From
INTEGRATION
to
Impact
Eighth Comprehensive evaluation of the GEF
The vast majority of GEF projects are rated in the satisfactory range for outcomes. The outcome rating assesses the extent to which a completed project achieved the outcome expected at implementation completion. Cumulatively, validated outcome ratings of 82 percent of completed projects are in the satisfactory range. Projects approved during GEF‑5 show improvement compared with earlier periods, with 85 percent rated satisfactory, up from 79 percent previously (figure 3.1). Although GEF-5 and GEF-6 projects show a higher percentage of projects in the satisfactory range, these figures may decline as more projects from these periods are completed. Historical data indicate that underperforming projects tend to take longer to close and, once completed, tend to lower the percentage of projects in the satisfactory range for their period.
While projects from GEF‑5 and GEF‑6 currently show higher satisfactory outcome rates, these figures may decline as more projects close, as historically underperforming projects tend to take longer to complete and often lower overall ratings once finalized. Box 3.1 provides examples of satisfactory or unsatisfactory performance in outcome achievement.
There are variations in outcome performance across focal areas, regions, country groups, and programmatic approaches. Among completed projects from GEF-5 onwards, the percentage of projects rated in the satisfactory outcome range varies across focal areas, ranging from 96 percent in land degradation to 84 percent in climate change. Regionally, a higher percentage of projects in Europe and Central Asia and Asia are rated in the satisfactory range for outcomes, while Africa and Latin America and the Caribbean have the lowest percentages. Since GEF-5, the share of completed projects rated in the satisfactory range for outcomes has increased across all regions compared to earlier periods. Projects in Latin America and the Caribbean showed the least improvement. A high percentage of global projects are rated in the satisfactory range.
| GEF Period | CEO endorsed/approved (no.) | Closed | Closed with terminal evaluation submitted to GEF Portal | Closed with validated ratings available | |||
|---|---|---|---|---|---|---|---|
| No. | % of approved projects | No. | % of closed projects | No. | % of closed projects | ||
| Through GEF-4 | 1,872 | 1,813 | 97 | 1,749 | 96 | 1,668 | 92 |
| GEF-5 | 839 | 718 | 86 | 656 | 91 | 613 | 85 |
| GEF-6 | 601 | 286 | 48 | 222 | 78 | 182 | 64 |
| GEF-7 | 671 | 22 | 3 | 15 | 68 | 12 | 55 |
| Total | 3,983 | 2,839 | 71 | 2,642 | 93 | 2,475 | 87 |
Sources: GEF Portal and GEF IEO Annual Performance Report (APR) 2026 data set, which includes completed projects for which terminal evaluations were independently validated through June 2025.
Note: Data exclude parent projects, projects with less than $0.5 million of GEF financing, enabling activities with less than $2 million of GEF financing, and projects from the Small Grants Programme. Closed projects refer to all projects closed as of June 30, 2025. The GEF IEO accepts validated ratings from some Agencies; however, their validation cycles may not align with the GEF IEO’s reporting cycle, which can lead to some projects with available terminal evaluations lacking validated ratings within the same reporting period; thus, validated ratings here are from the APR data set only.
The Environmentally Sound Management of Municipal and Hazardous Solid Waste project in Senegal (GEF ID 4888, United Nations Industrial Development Organization) was assessed as highly relevant, coherent, and cost-effective in supporting waste management, and in addressing the needs of vulnerable groups. It reduced emissions of unintentional persistent organic pollutants and open waste burning, and increased awareness of waste management’s health and environmental implications. Therefore, its outcome achievement was rated satisfactory.
In contrast, the Mainstreaming Biodiversity Conservation through Low-Impact Ecotourism project in Panama (GEF ID 9889, Inter-American Development Bank) was rated unsatisfactory as it completed only two outputs and failed to achieve intended outcomes such as improvements in financial sustainability and management effectiveness of protected areas.
GEF projects in SIDS or fragile and conflict-affected situations face greater challenges in achieving their intended outcomes. About a quarter of the projects in SIDS and 20 percent in fragile and conflict-affected situations are rated in the unsatisfactory range, which is lower than performance in other countries. The Evaluation of GEF Support in Fragile and Conflict-Affected Situations highlighted the challenges—such as social conflict, economic uncertainty, political fragility, and weak governance—that projects face in these settings, leading to lower achievements (GEF IEO 2024b). In SIDS, capacity constraints contribute to lower outcome achievements. While past projects in least developed countries (LDCs) were less likely to receive satisfactory outcome ratings, their performance has significantly improved in recent periods.
A high proportion of completed child projects under integrated programs have achieved satisfactory outcomes. Specifically, 93 percent of the 14 evaluated child projects were rated in the satisfactory range for outcome achievement. Although slightly lower percentages were observed for child projects from other programs (87 percent) and stand-alone projects (86 percent) approved during the same period, the differences are not statistically significant.
For projects to achieve their intended outcomes, it is essential that they achieve the expected results identified in their results measurement frameworks. These include both corporate-level indicators and those that are specific to individual projects.
At project completion, most indicators in project results measurement frameworks were measured and reported using consistent units. The evaluation of Components of the GEF´s Results-Based Management System reviewed 2,213 indicators listed in the results measurement framework of GEF-6 and GEF-7 completed projects with terminal evaluations (GEF IEO 2025 forthcoming-c). It found that 91 percent had achievements measured and reported. In 88 percent of cases, this reporting consistently used the units specified in the results measurement framework (table 3.2). Where indicators were specified, 64 percent fully met their targets and when considering only indicators reported using consistent units, 73 percent fully achieved their specified targets. Thus, in majority of instances projects fully achieve the results specified in their results measurement framework.

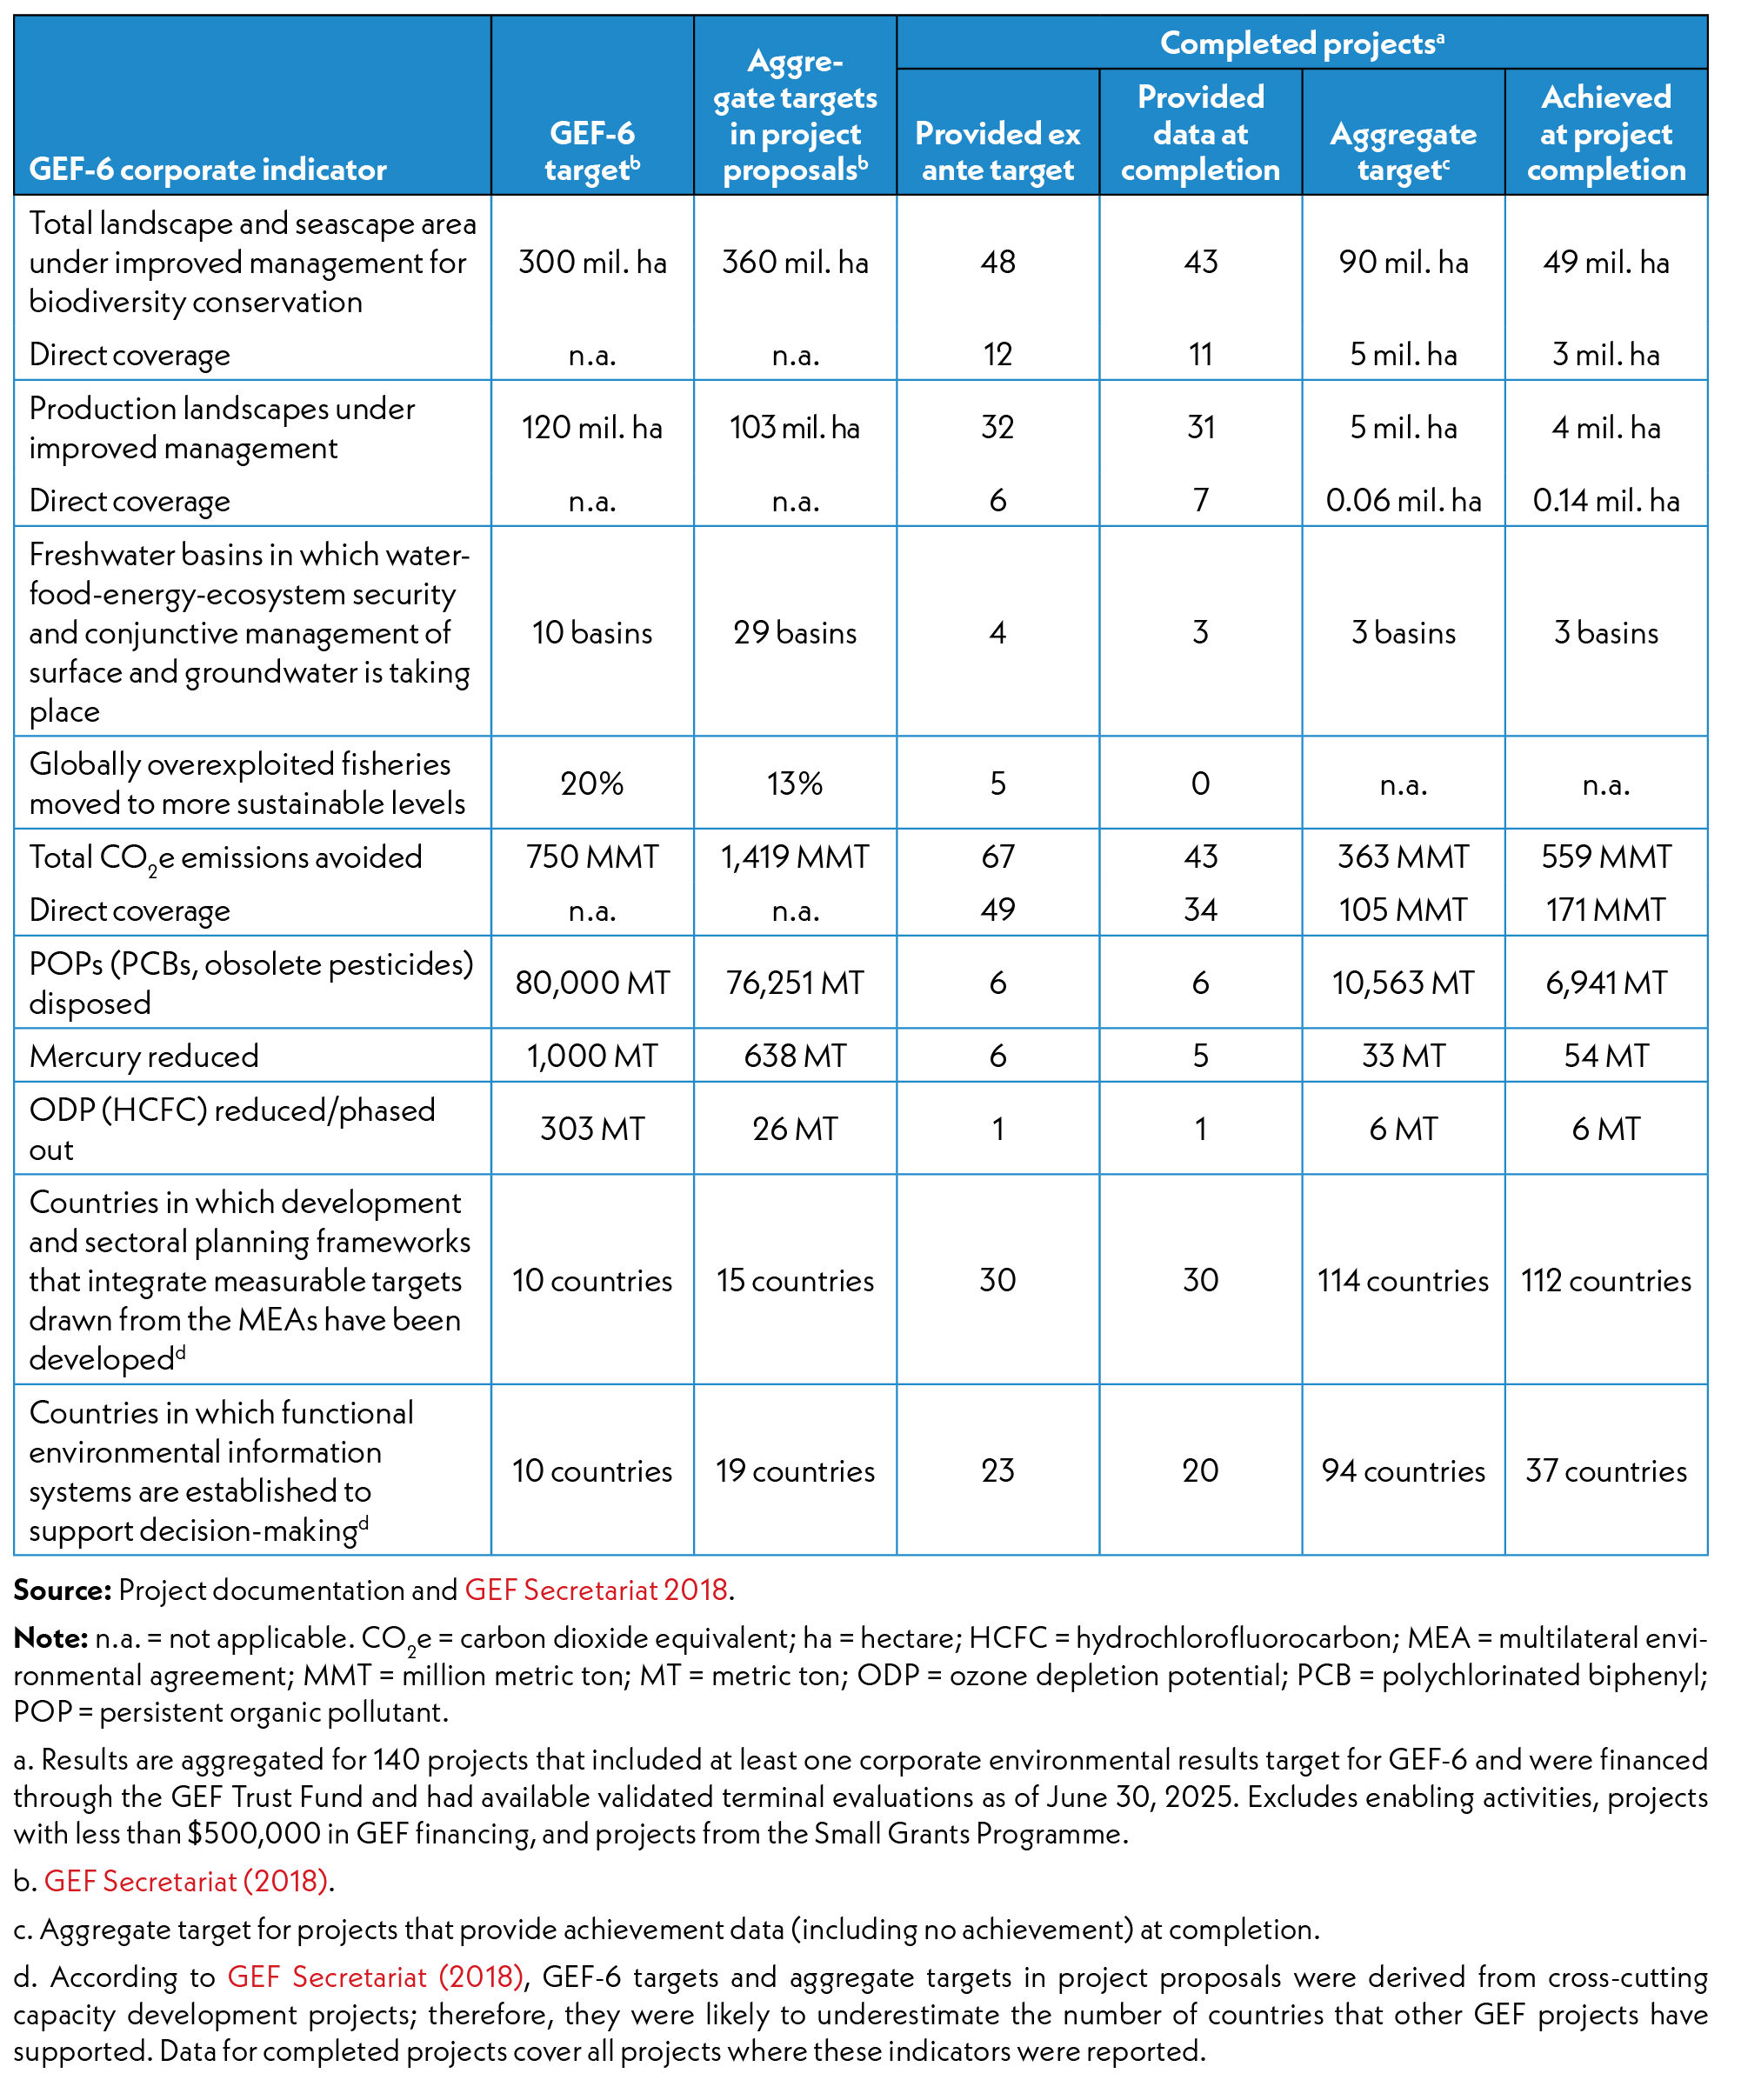
The programming documents for each GEF replenishment period set targets for corporate environmental results indicators. The remainder of this subsection reviews progress toward achieving the corporate environmental targets established for GEF‑6.
During GEF-6, 601 projects were approved, 511 of which were financed by the GEF Trust Fund. Of these 511, 147 have been completed; project results achieved have been assessed for 140 that included a corporate results–related target in its results measurement framework. Data on achievement of corporate environmental targets for completed GEF-6 projects was compiled from reporting on results achievement in terminal evaluations and/or the last project implementation report (PIR) of the given project. Table 3.3 provides a summary of performance based on actual achievement of targets for these 140 projects.
The GEF has made substantial progress toward achieving the GEF-6 corporate environmental results targets, although full achievement of all targets remains uncertain. Of the 10 corporate environmental results targets for GEF-6, 5 are on track. Among 43 completed projects with available data on ex ante targets and actual results, the reported greenhouse gas emissions avoided totaled 559 million metric tons of carbon dioxide equivalent (MMT CO2e), surpassing the aggregate target of 363 MMT CO2e. For direct emissions avoidance alone, projects achieved 171 MMT CO2e compared to the target of 105 MMT CO2e. Notably, the aggregate projected CO2 avoidance from all project proposals nearly doubled the GEF-6 portfolio target, and completed projects significantly outperformed the combined targets; this places the GEF firmly on track to meet its goals, despite gaps in reporting.
The GEF is also on track to meet targets related to country coverage for environmental information systems, development and sectoral planning frameworks, freshwater basin coverage, and mercury reduction. Other targets show less promising trends. The corporate target for reducing ozone-depleting substances is unlikely to be met, as the total expected reductions from approved projects fall well below the target, even though one completed project met its goal. Similarly, progress on indicators for production landscapes and landscapes/seascapes under improved management for biodiversity remains below the pace required, although substantial achievement is still possible. Limited reporting on the indicator for globally overexploited fisheries shifted to sustainable levels makes it difficult to assess progress or make reliable projections in this area.
Nearly two-thirds of completed GEF projects are rated in the likely range for sustainability. The sustainability rating assesses the extent to which a project’s outcomes are durable and the project is likely to achieve its expected long-term impact. Cumulatively, 64 percent of completed projects are rated in the likely range for sustainability. GEF-6 shows a high percentage of projects in the likely range, although this figure may change as more projects approved during this period are completed (figure 3.2).
Although the overall share of projects rated in the likely range for sustainability has increased, projects in Africa, SIDS, fragile and conflict-affected situations, and LDCs continue to face higher sustainability risks. In recent replenishment periods, likely sustainability ratings vary: from chemicals and waste at 81 percent to biodiversity at 66 percent. Global projects lead in terms of sustainability ratings from GEF-5 onwards, while also demonstrating the greatest improvements compared to previous periods. Although sustainability ratings in Africa have also improved, projects in this region still face significant risks at implementation completion. A substantial share of projects in fragile and conflict-affected situations, SIDS, and LDCs are rated in the unlikely range for sustainability. Factors influencing sustainability in these contexts are further elaborated on in section 3.2. Among the 11 child projects from integrated programs with available sustainability ratings, 8 (73 percent) were assessed in the likely range for sustainability. Despite this nominally higher share compared to child projects from other programs (68 percent) and stand-alone projects (69 percent), the differences are not statistically significant, indicating broadly comparable performance across project types.
Over 80 percent of completed GEF projects are rated in the satisfactory range for both implementation and execution. Implementation ratings reflect how well GEF Agencies have fulfilled their roles in project design, start-up, supervision, application of policies, M&E, and adaptive management. Execution ratings assess how effectively executing agencies delivered project activities under the supervision of the GEF Agency, including procurement, stakeholder engagement, and on-the-ground monitoring.
Cumulatively, 82 percent of projects are rated satisfactory for implementation and execution (figure 3.3). Both measures have improved since GEF-5, with implementation quality now consistent across focal areas and execution showing moderate variation. Projects in Africa and SIDS tend to face greater challenges in both implementation and execution. Interestingly, projects in fragile and conflict-affected contexts experience more pronounced difficulties in implementation than execution. All evaluated child projects from integrated programs received satisfactory ratings for implementation and execution; a higher percentage of stand-alone projects were rated satisfactory for implementation than child projects from other programs.
Projects rated satisfactory for implementation and execution are more likely to achieve satisfactory outcome ratings. Outcome ratings are positively correlated with both implementation and execution (correlation coefficients of 0.59 and 0.56, respectively). Terminal evaluations highlight that effective implementation facilitates coordination and ensures timely delivery of outputs, whereas weak implementation often results in limited or incomplete output achievement. For instance, the Integrated Sound Management of Mercury in Indonesia’s Artisanal and Small-scale Gold Mining (GEF ID 9707, United Nations Development Programme [UNDP]) project was rated highly satisfactory for both outcomes and implementation, owing to strong coordination and timely execution. In contrast, Scaling up Sustainable Land Management and Biodiversity Conservation to Reduce Environmental Degradation in Small Scale Agriculture in Western Kenya (GEF ID 5272, United Nations Environment Programme [UNEP]) received unsatisfactory ratings for both outcomes and implementation, with only 4 of 21 key outputs fully delivered and 7 not delivered at all because of weak implementation.
There has been substantial improvement in the quality of M&E design since GEF-5, while progress in implementing M&E plans has been more limited. M&E ratings assess how well a plan was designed and how effectively it was implemented to monitor progress and results. For projects approved during GEF-4 and earlier, ratings for design and implementation were similar (figure 3.4). From GEF-5 onward, design quality improved significantly, but gains in implementation were more modest—indicating that strengthening M&E implementation remains a greater challenge than improving design.
The quality of M&E has improved across most focal areas, with the exception of land degradation. International waters shows the most significant progress, with 88 percent of projects rated satisfactory for M&E design in recent periods. Multifocal area projects have also improved, but about 23 percent still fall into the unsatisfactory range—similar to land degradation, which has not seen an improvement in ratings.
For M&E implementation, chemicals and waste leads, with 85 percent of projects rated satisfactory. In contrast, multifocal area and land degradation projects trail behind, with only 71 percent and 65 percent, respectively, rated satisfactory. The lower ratings for land degradation are partly linked to implementation in countries with challenging operational environments.
Regionally, 80 percent of projects in Latin America and the Caribbean since GEF-5 are rated satisfactory for M&E design. However, 20 percent fall short on implementation. Global projects tend to perform better in M&E implementation than design, while projects in SIDS have the smallest percentage of satisfactory ratings in both categories.