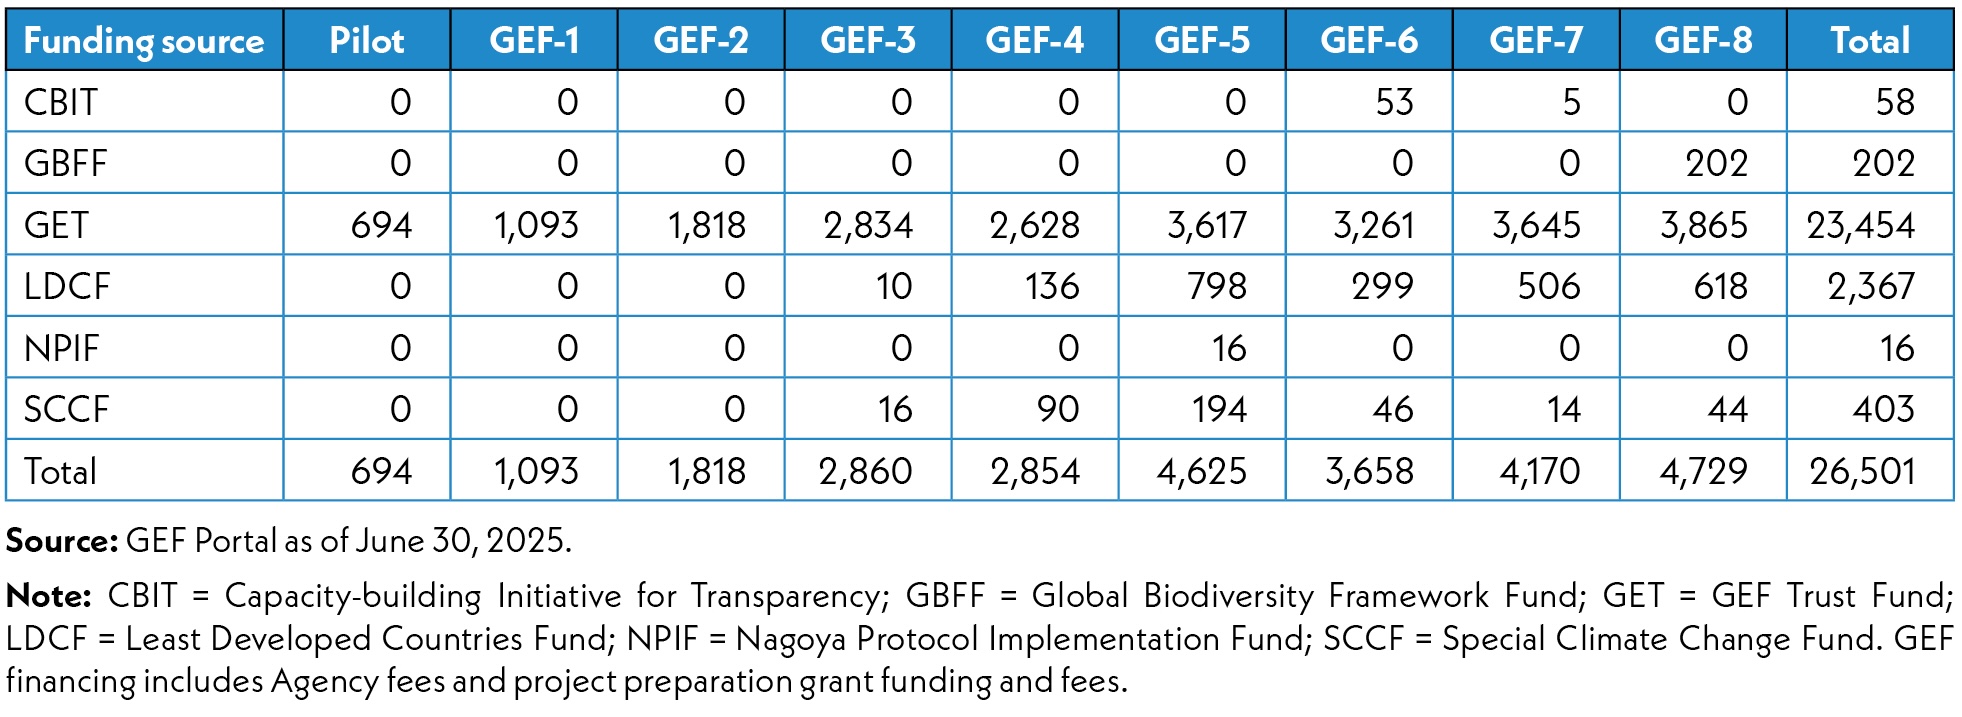
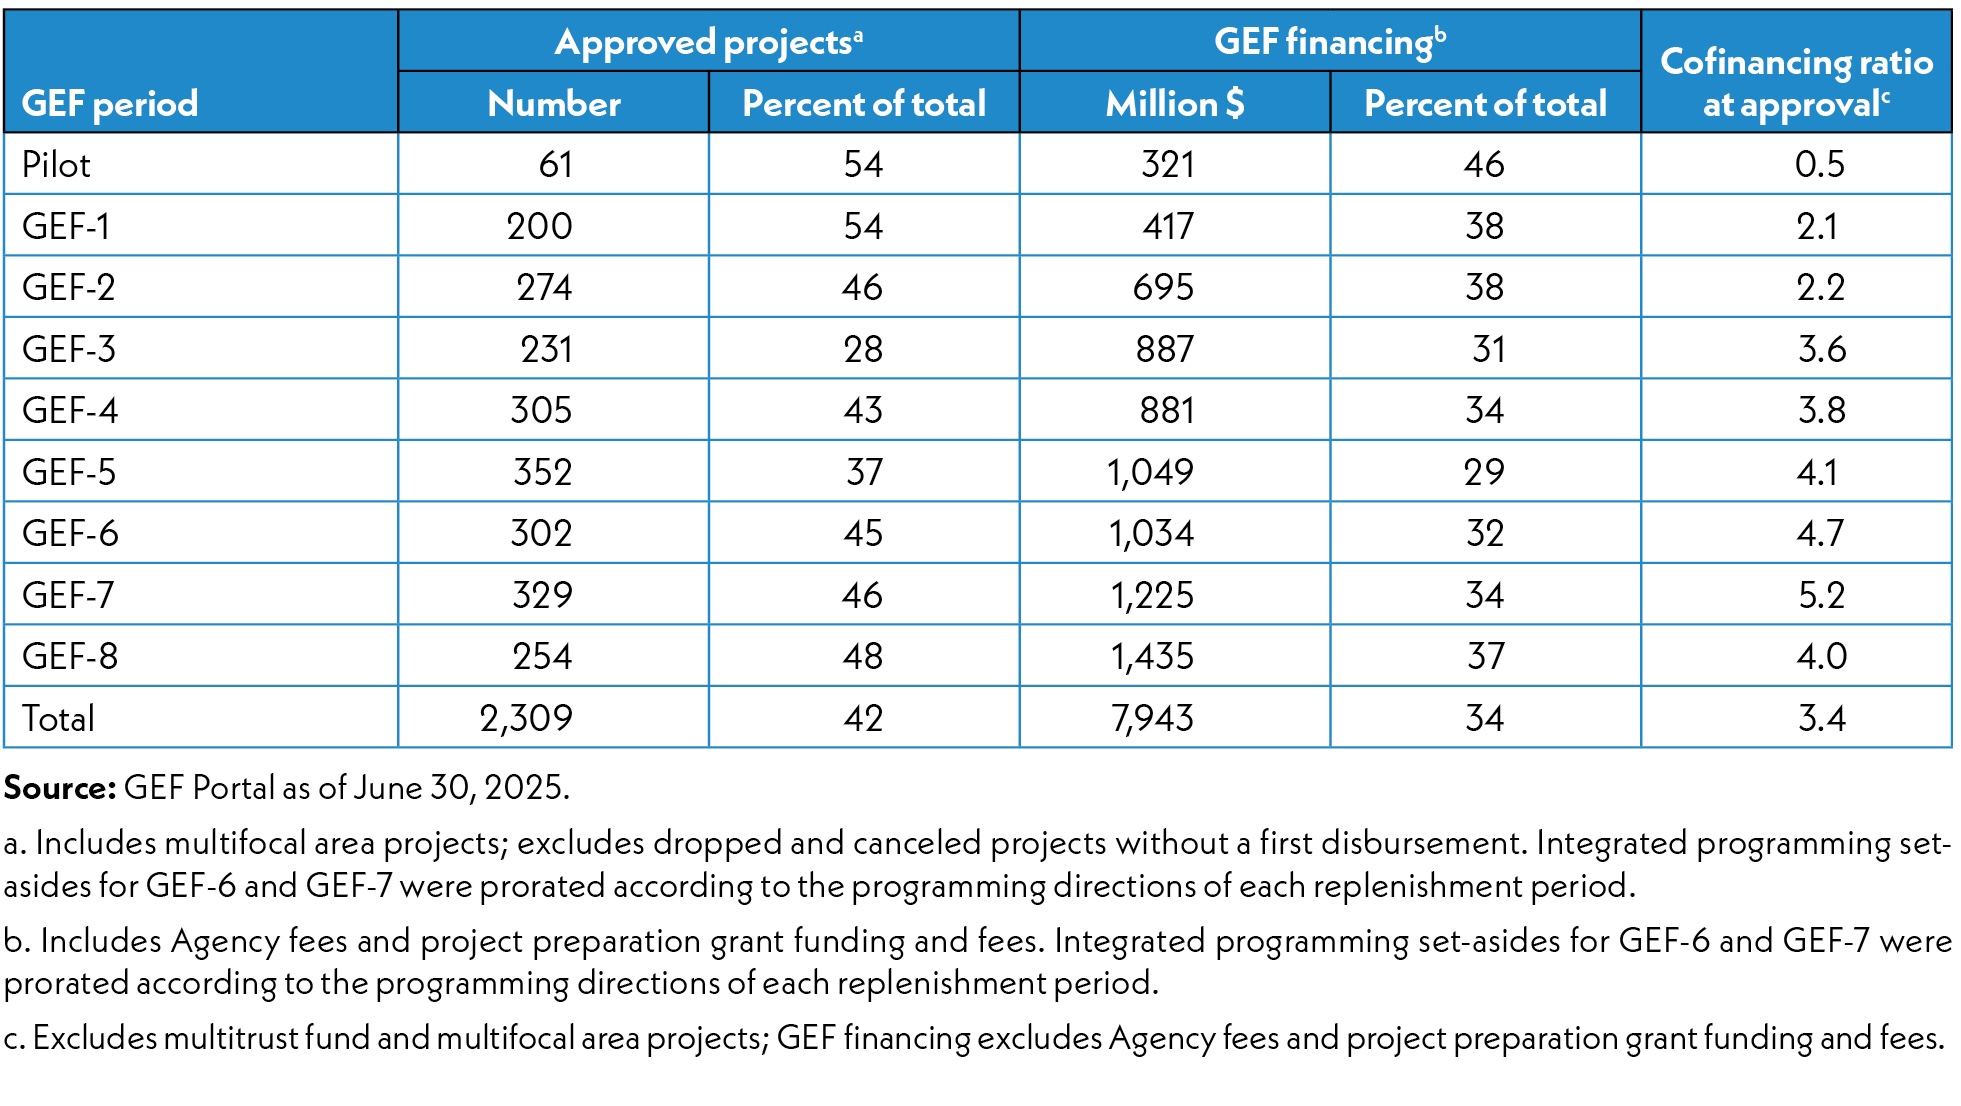
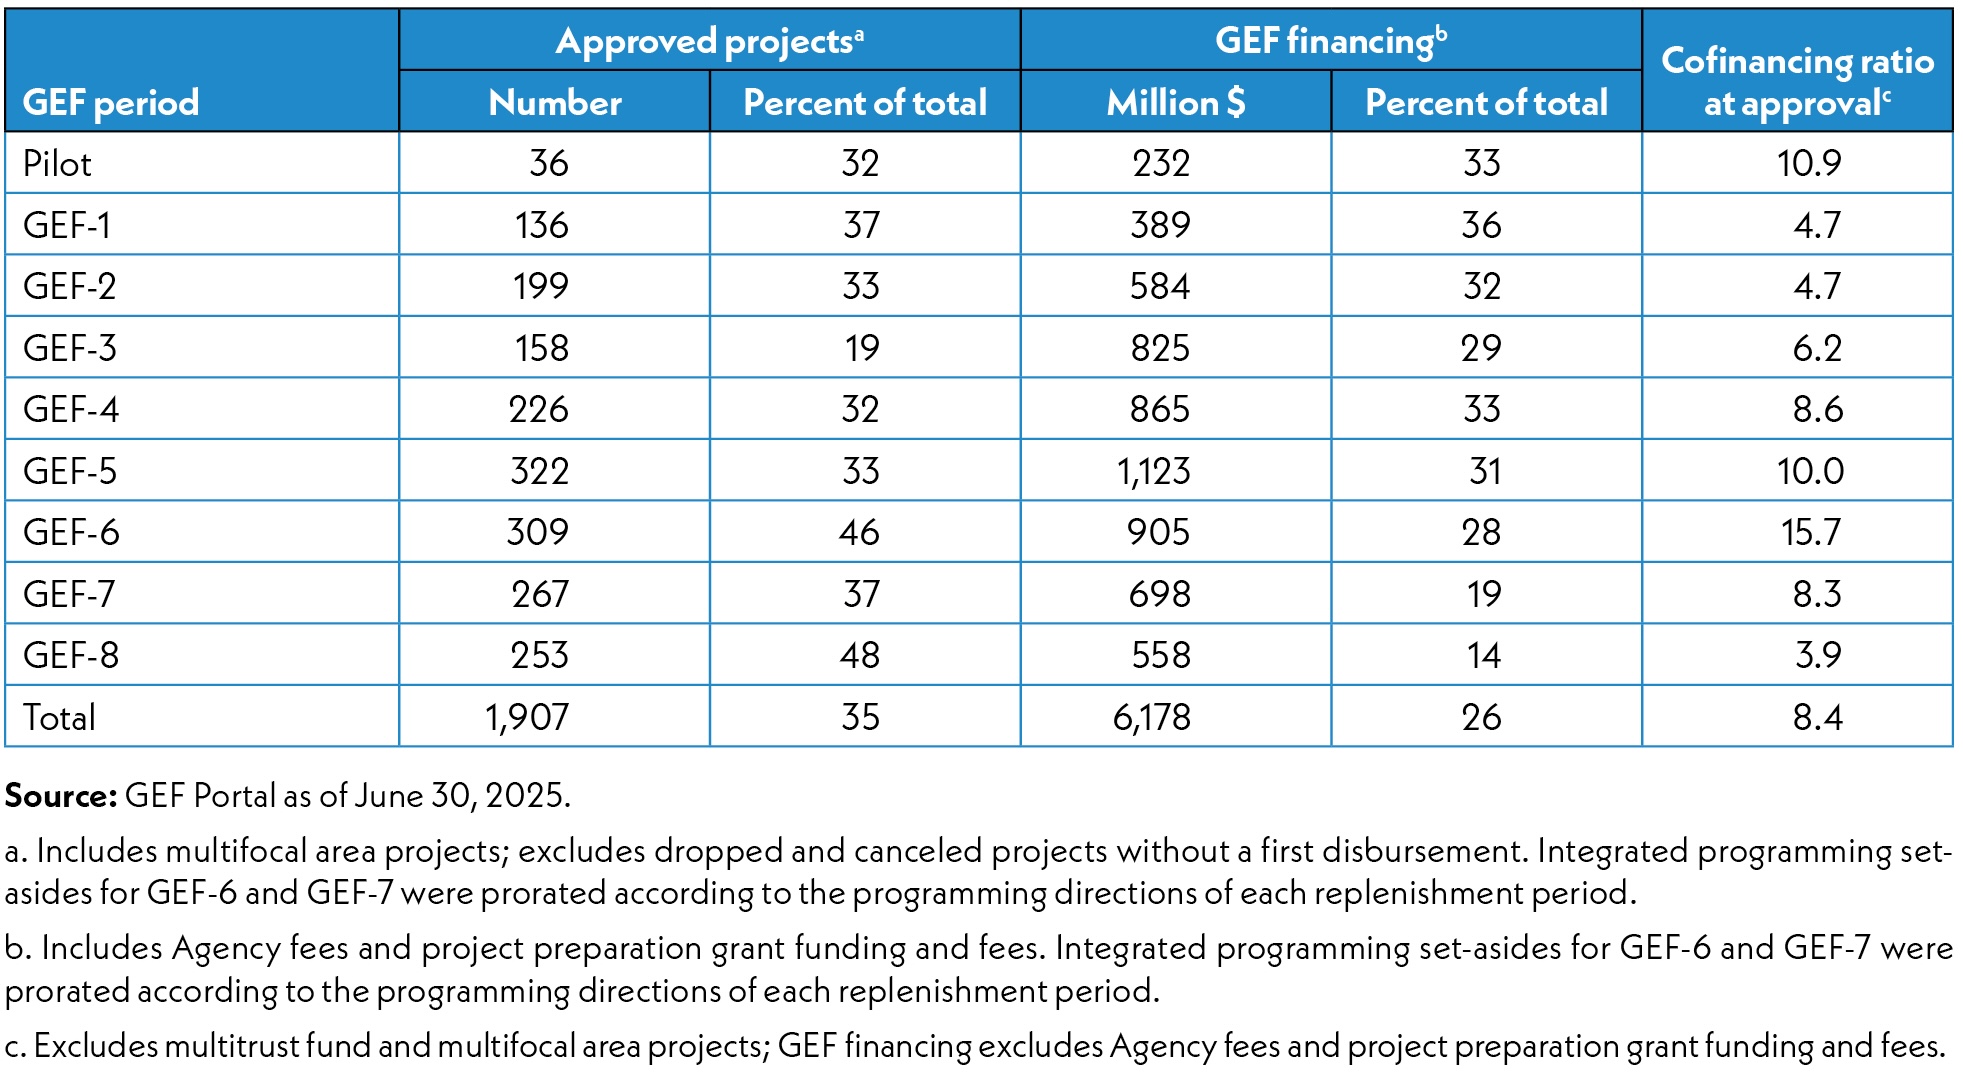
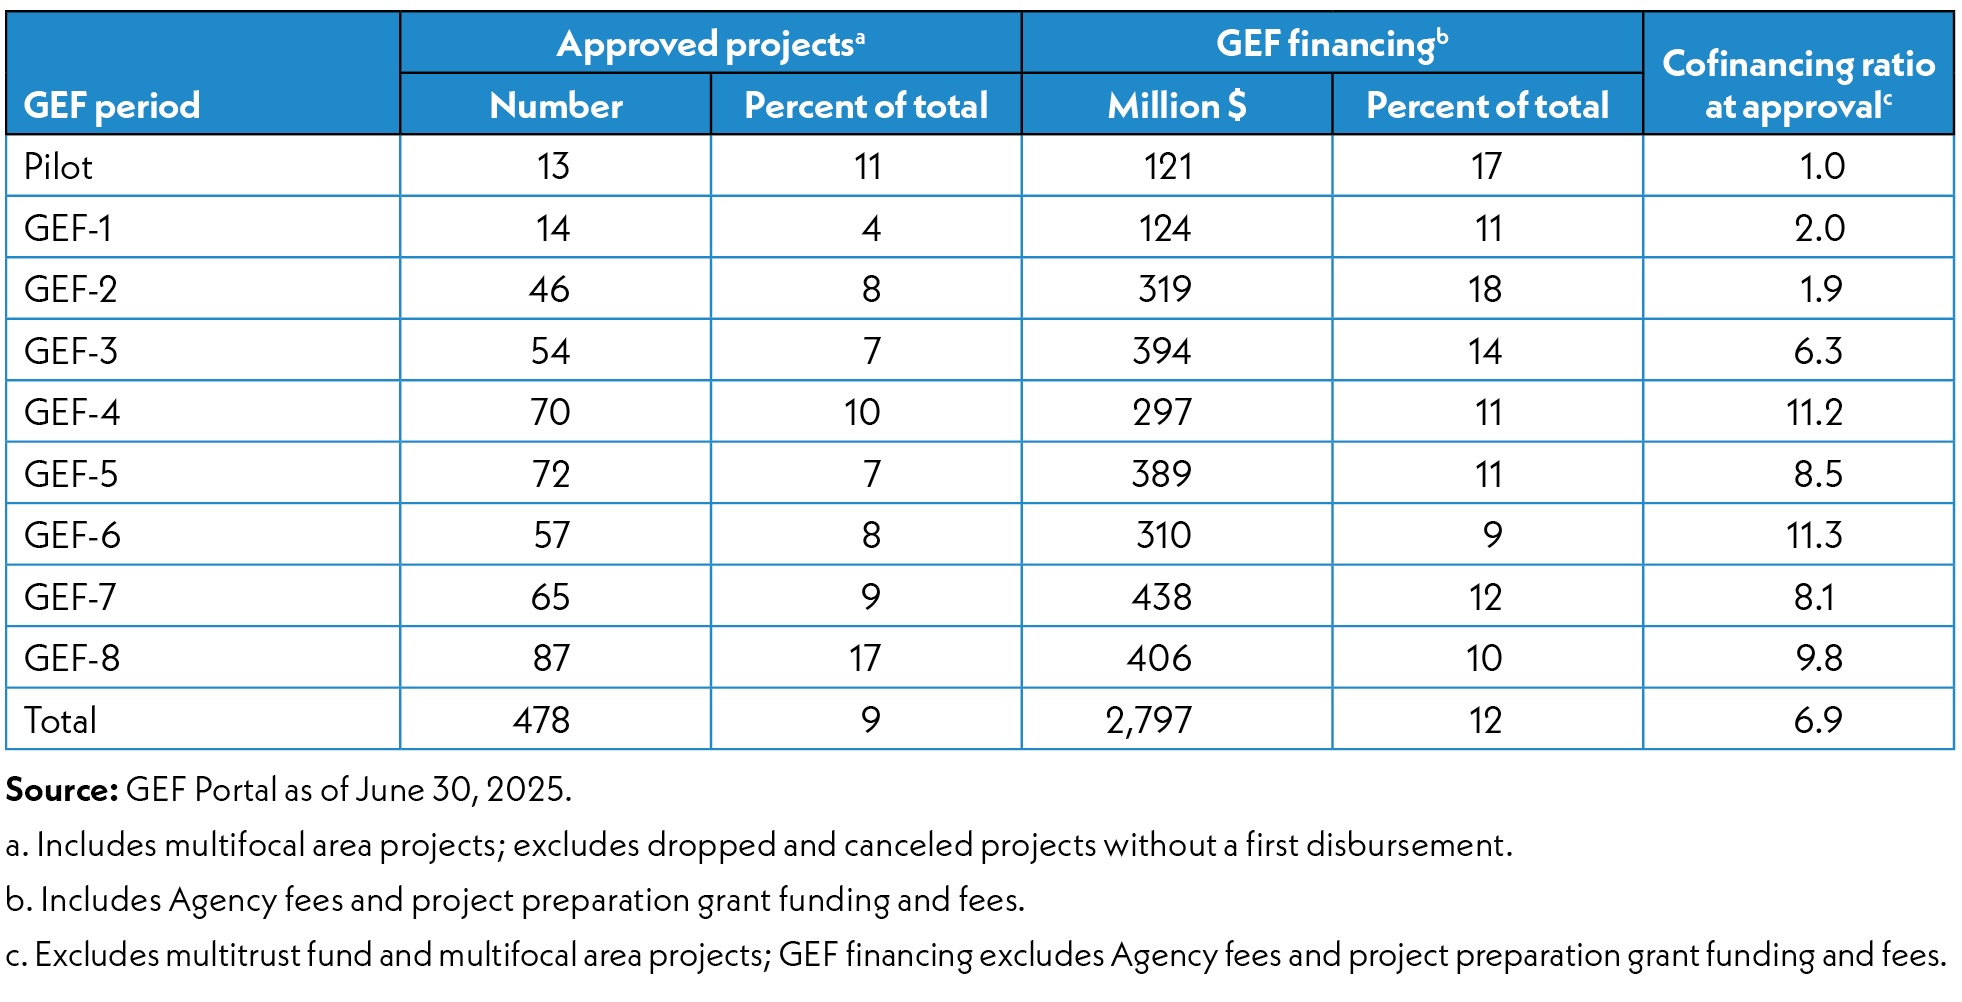
Table D.1 Number of projects by funding source and replenishment period
Table D.2 Financing by GEF funding source and replenishment period (million $)
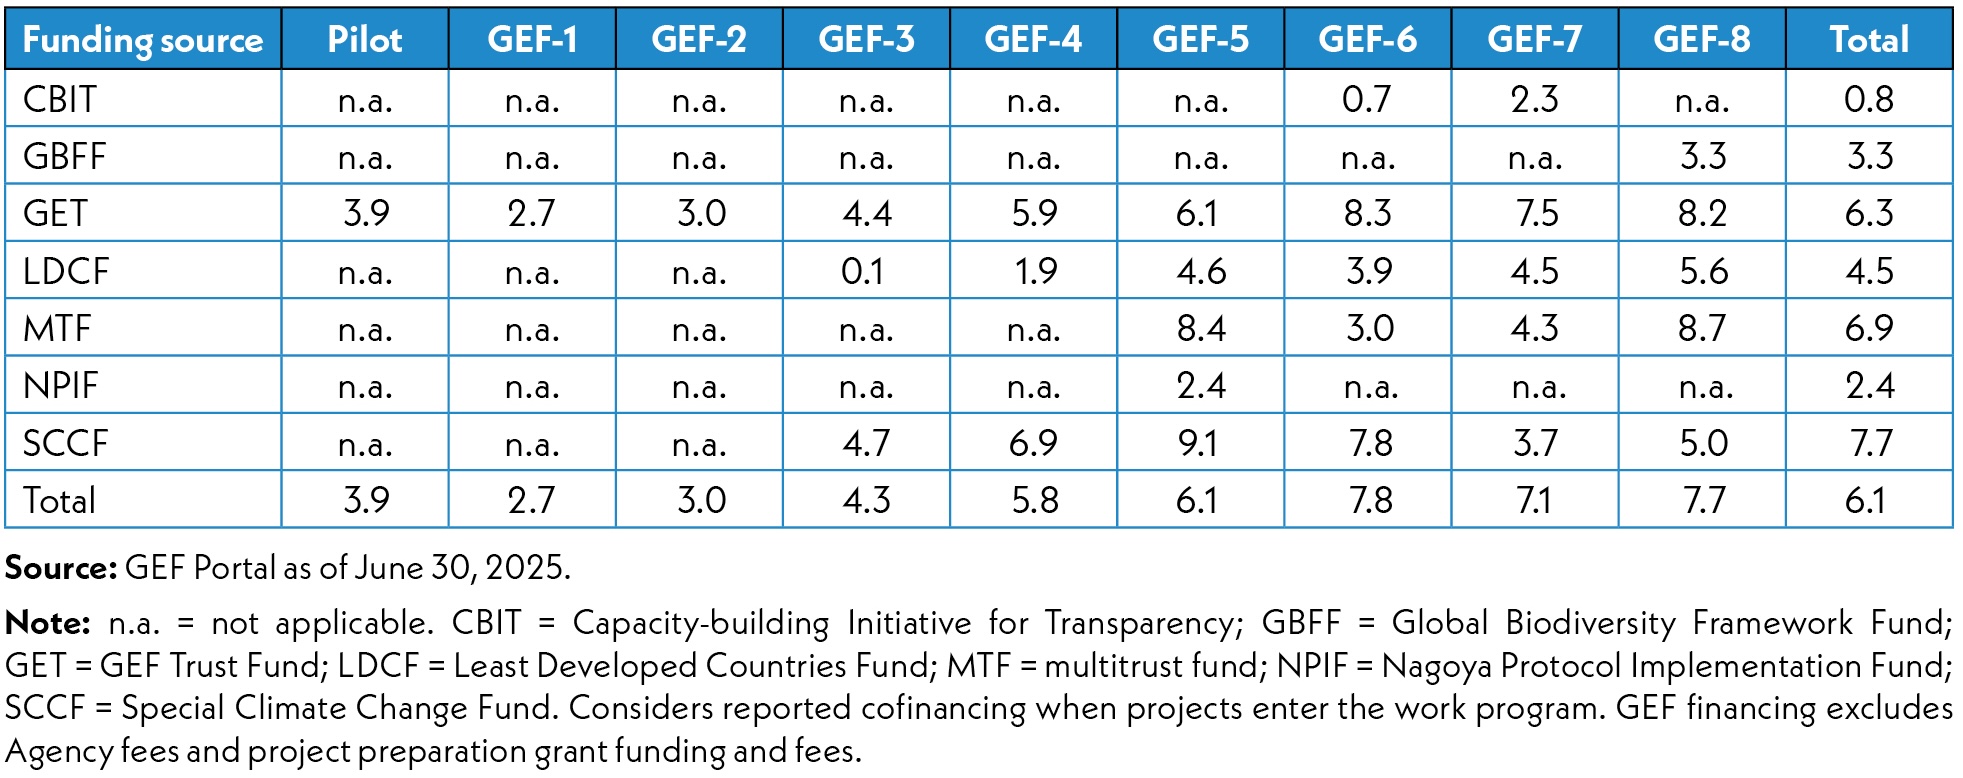
Table D.3 Cofinancing ratio by funding source and replenishment period
Table D.4 Distribution of GEF Trust Fund financing by focal area/corporate program and replenishment period (%)
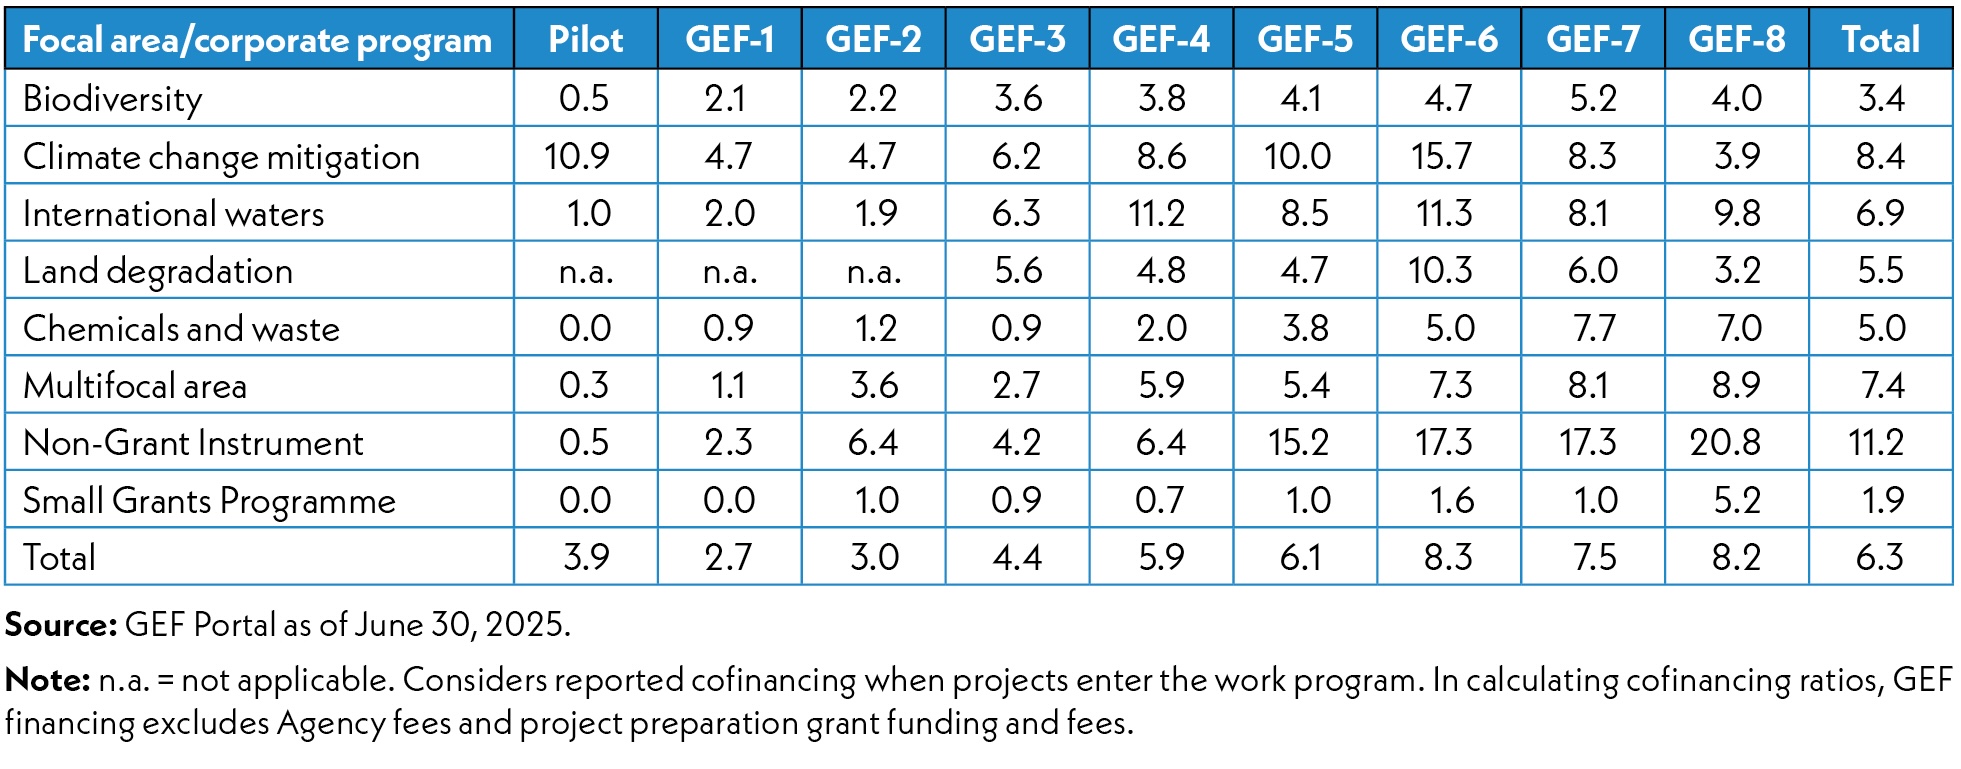
Table D.5 Cofinancing ratio in GEF Trust Fund portfolio by focal area/corporate program and replenishment period
Table D.6 Multifocal area projects as % of GEF Trust Fund portfolio and financing by replenishment period
Table D.7 Cofinancing ratio in GEF Trust Fund portfolio by Agency type and replenishment period
Table D.8 Distribution of GEF Trust Fund financing by Agency and replenishment period (%)
Table D.9 Distribution of GEF Trust Fund financing by programmatic approach and replenishment period (%)
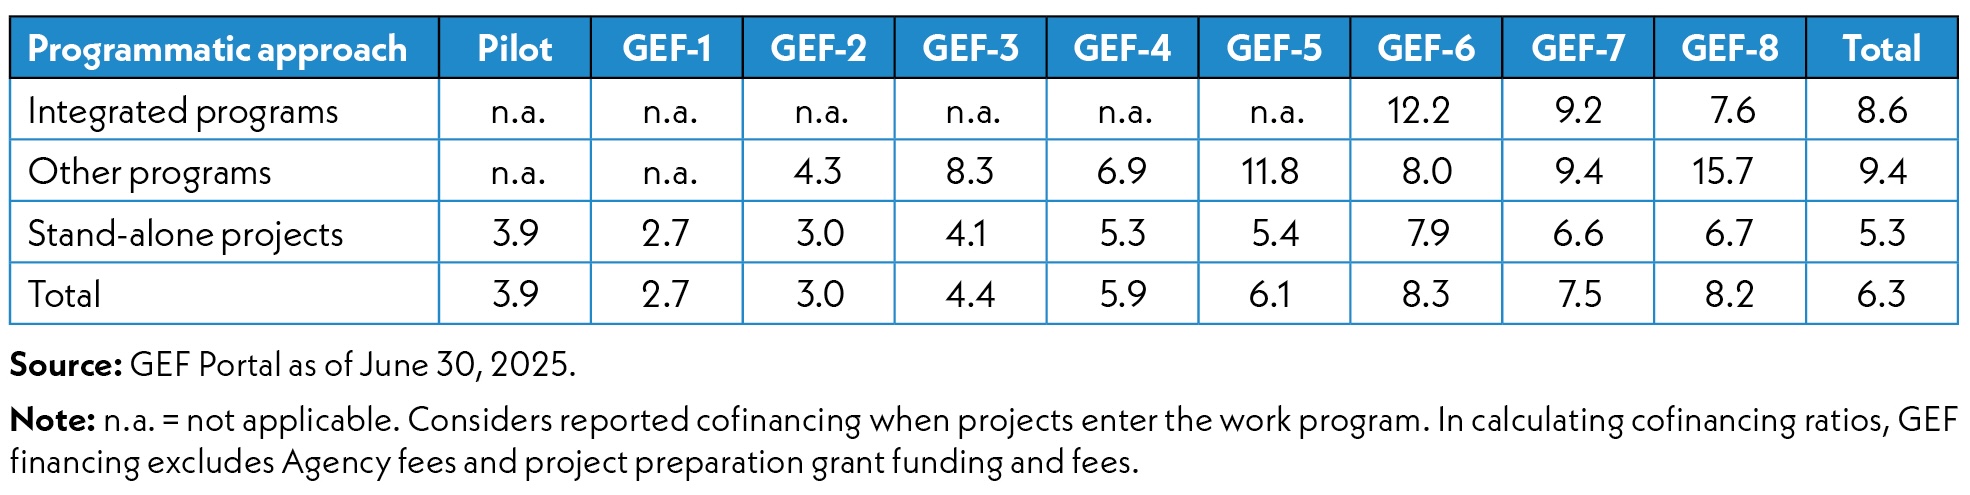
Table D.10 Cofinancing ratio in GEF Trust Fund portfolio by programmatic approach and replenishment period
Table D.11 Distribution of GEF Trust Fund financing by country group and replenishment period (%)
Table D.12 Cofinancing ratio in GEF Trust Fund portfolio by country group and replenishment period
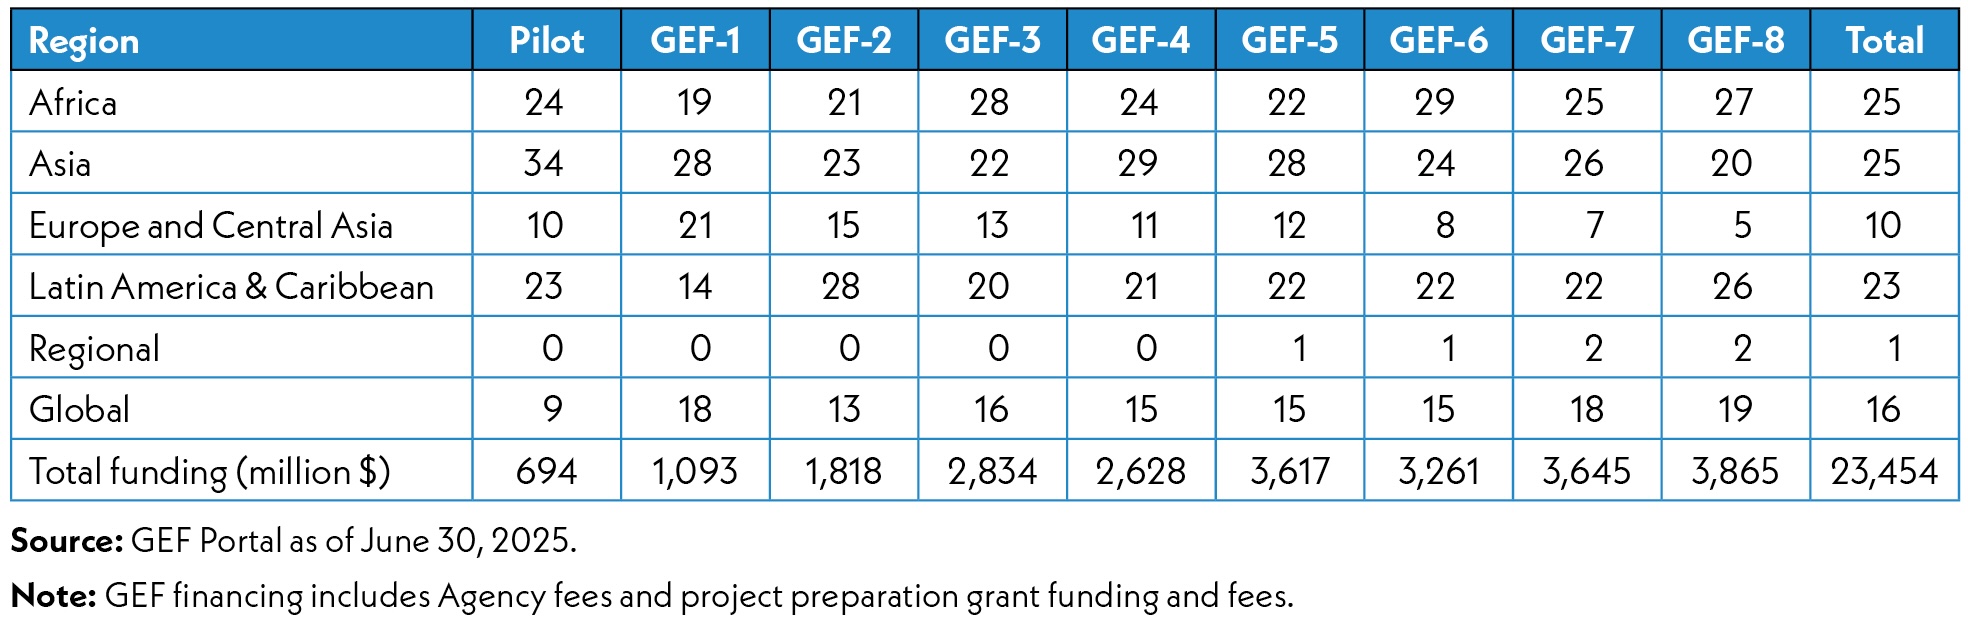
Table D.13 Distribution of GEF Trust Fund financing by region and replenishment period (%)
Table D.14 Cofinancing ratio in GEF Trust Fund portfolio by region and replenishment period
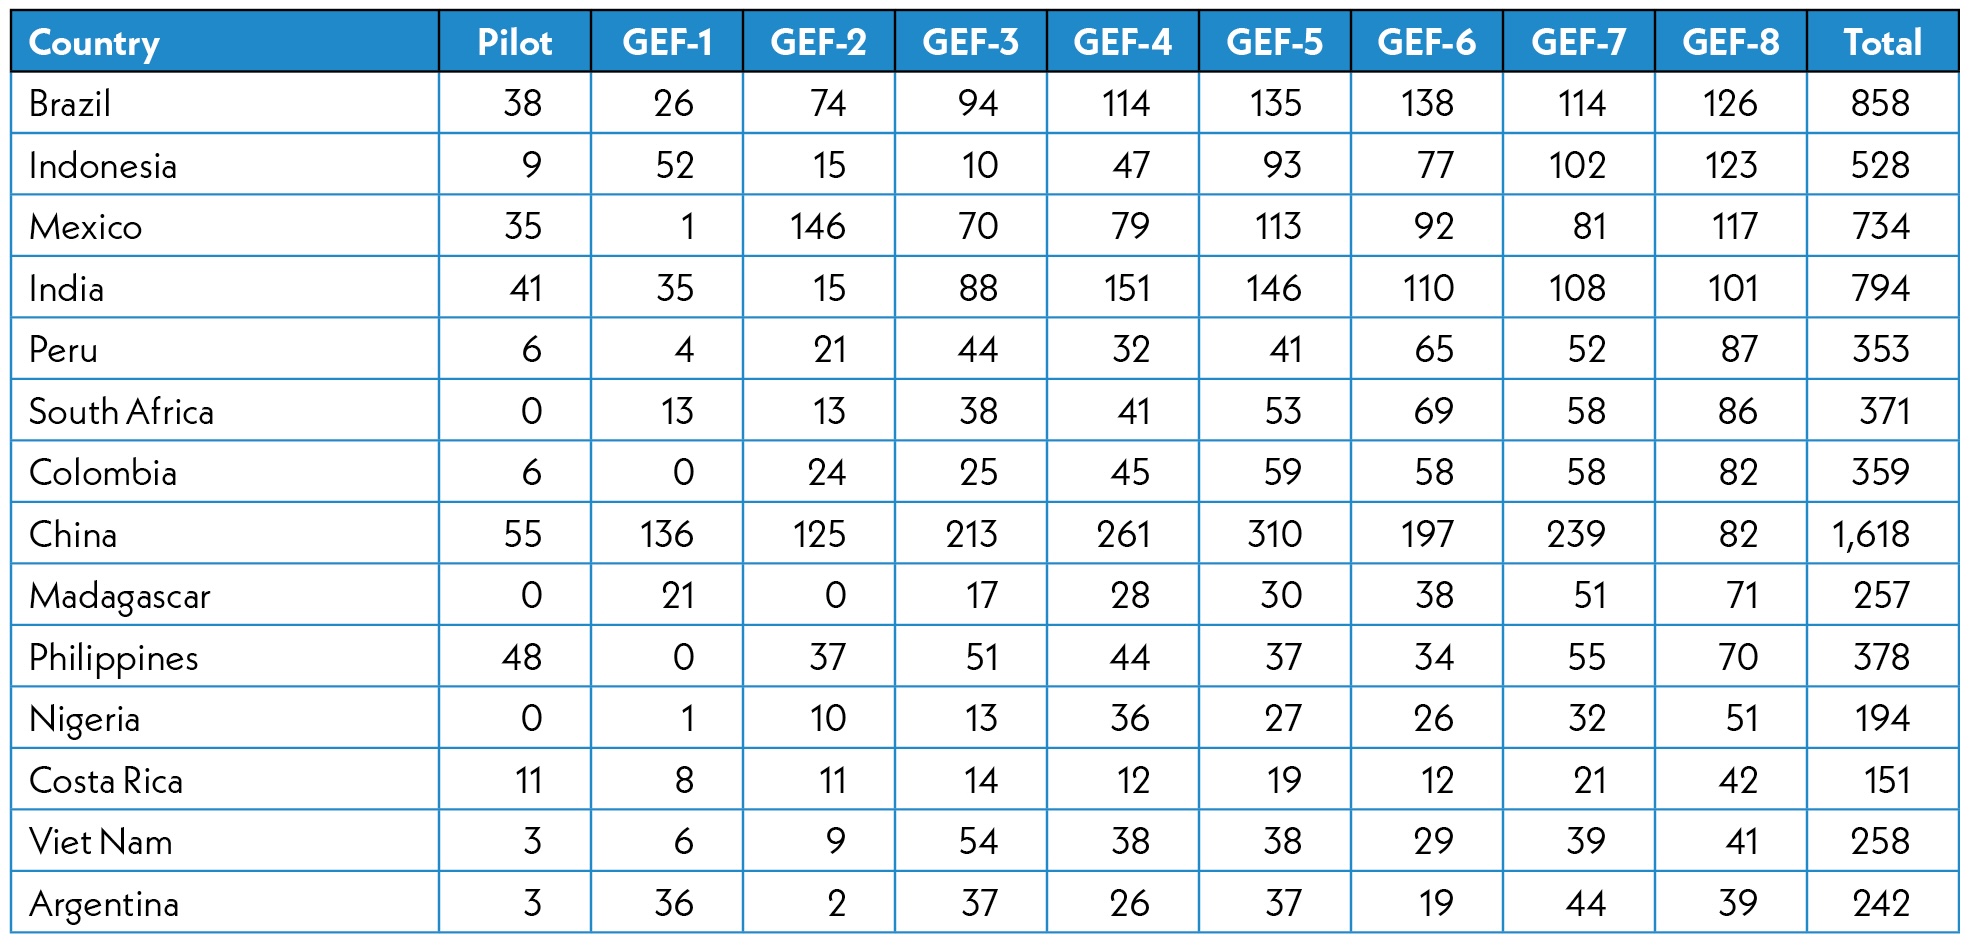
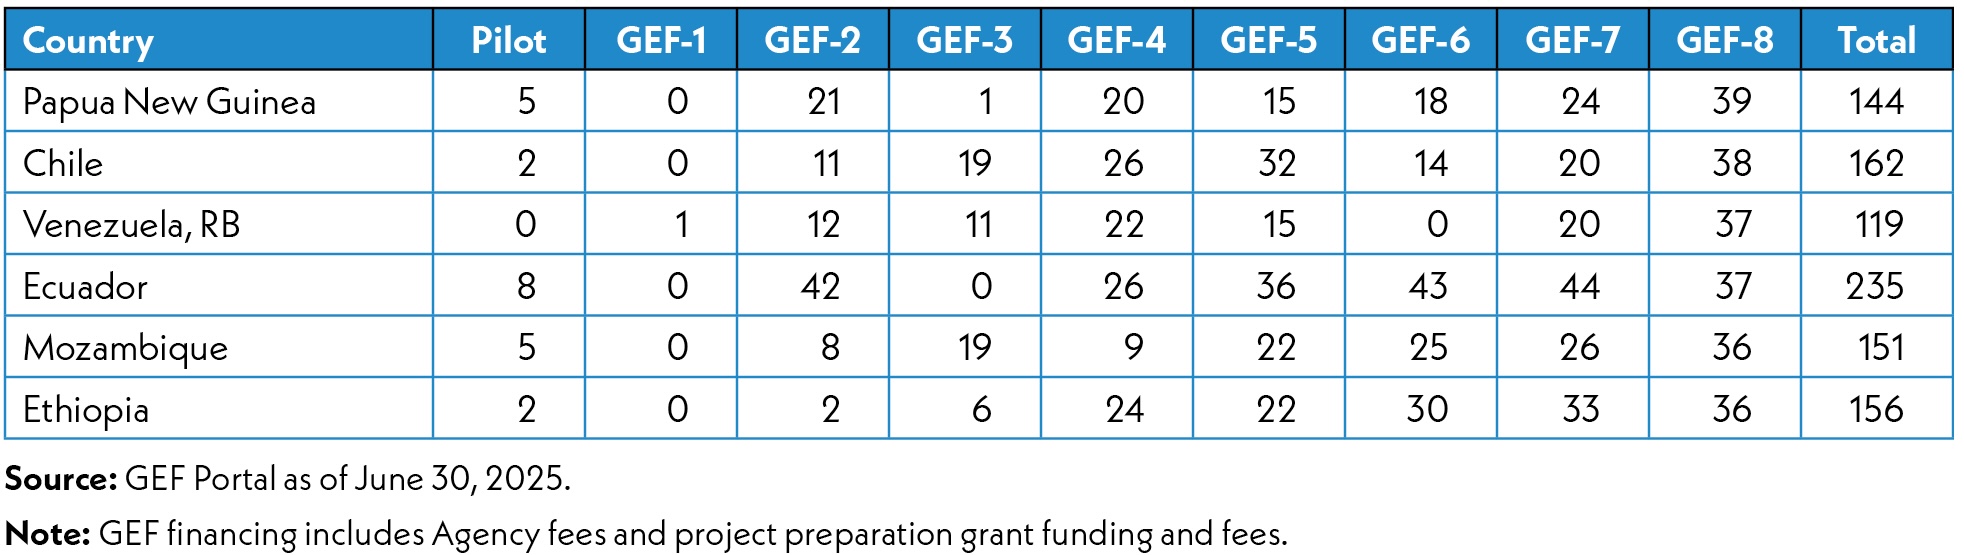
Table D.15 Funding for GEF-8 top 20 countries by replenishment period (million $)
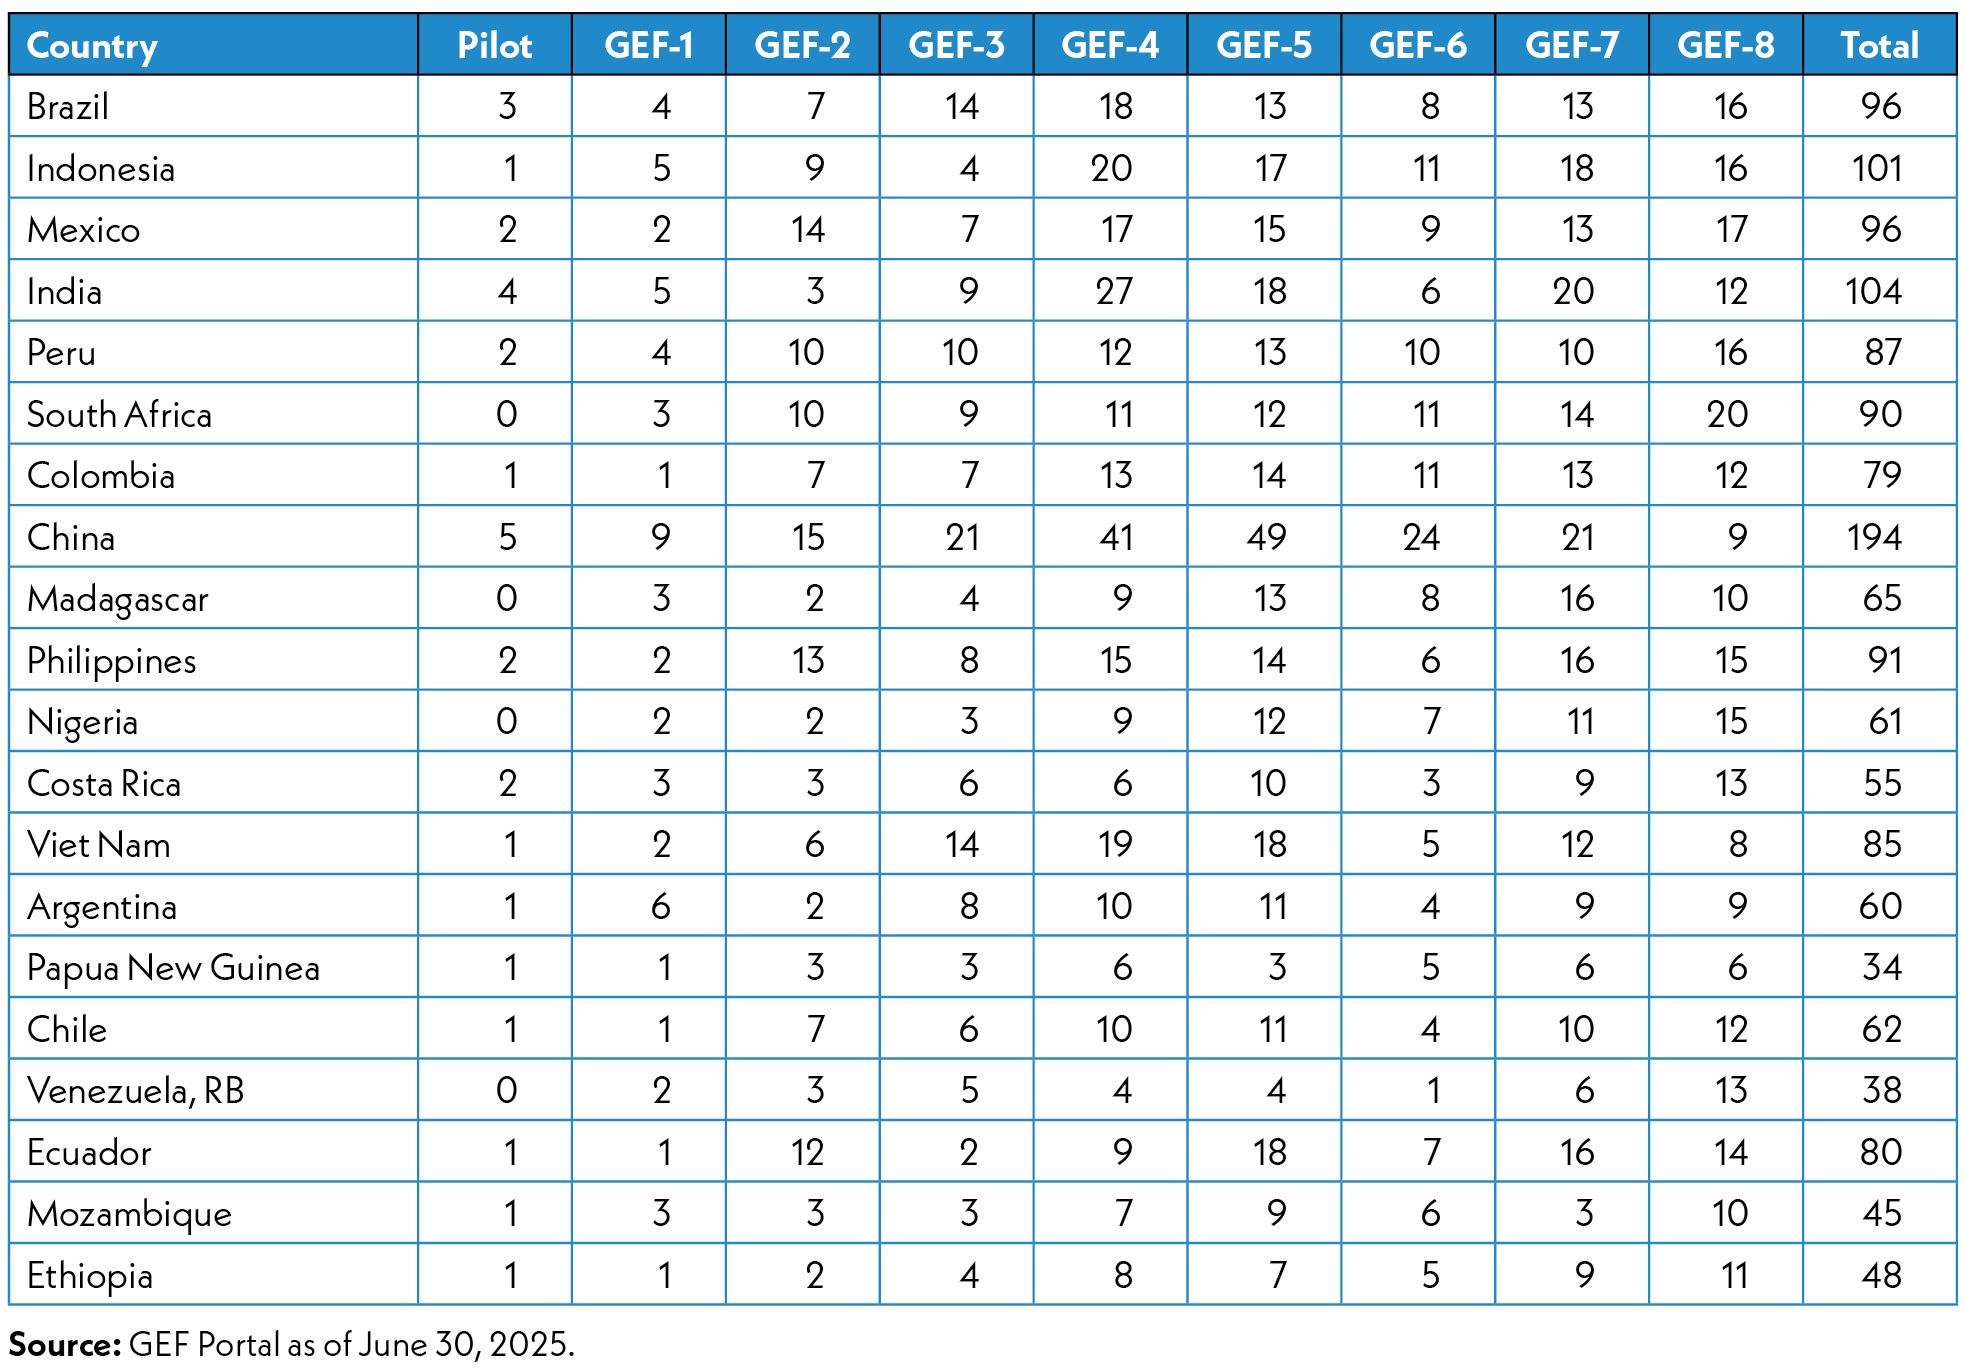
Table D.16 Number of projects for GEF-8 top 20 countries by replenishment period
Table D.17 Distribution of all GEF projects by replenishment period and project cycle stage (%)
Table D.18 Portfolio of closed projects by replenishment period
Table D.1 umber of projects by funding source and replenishment period
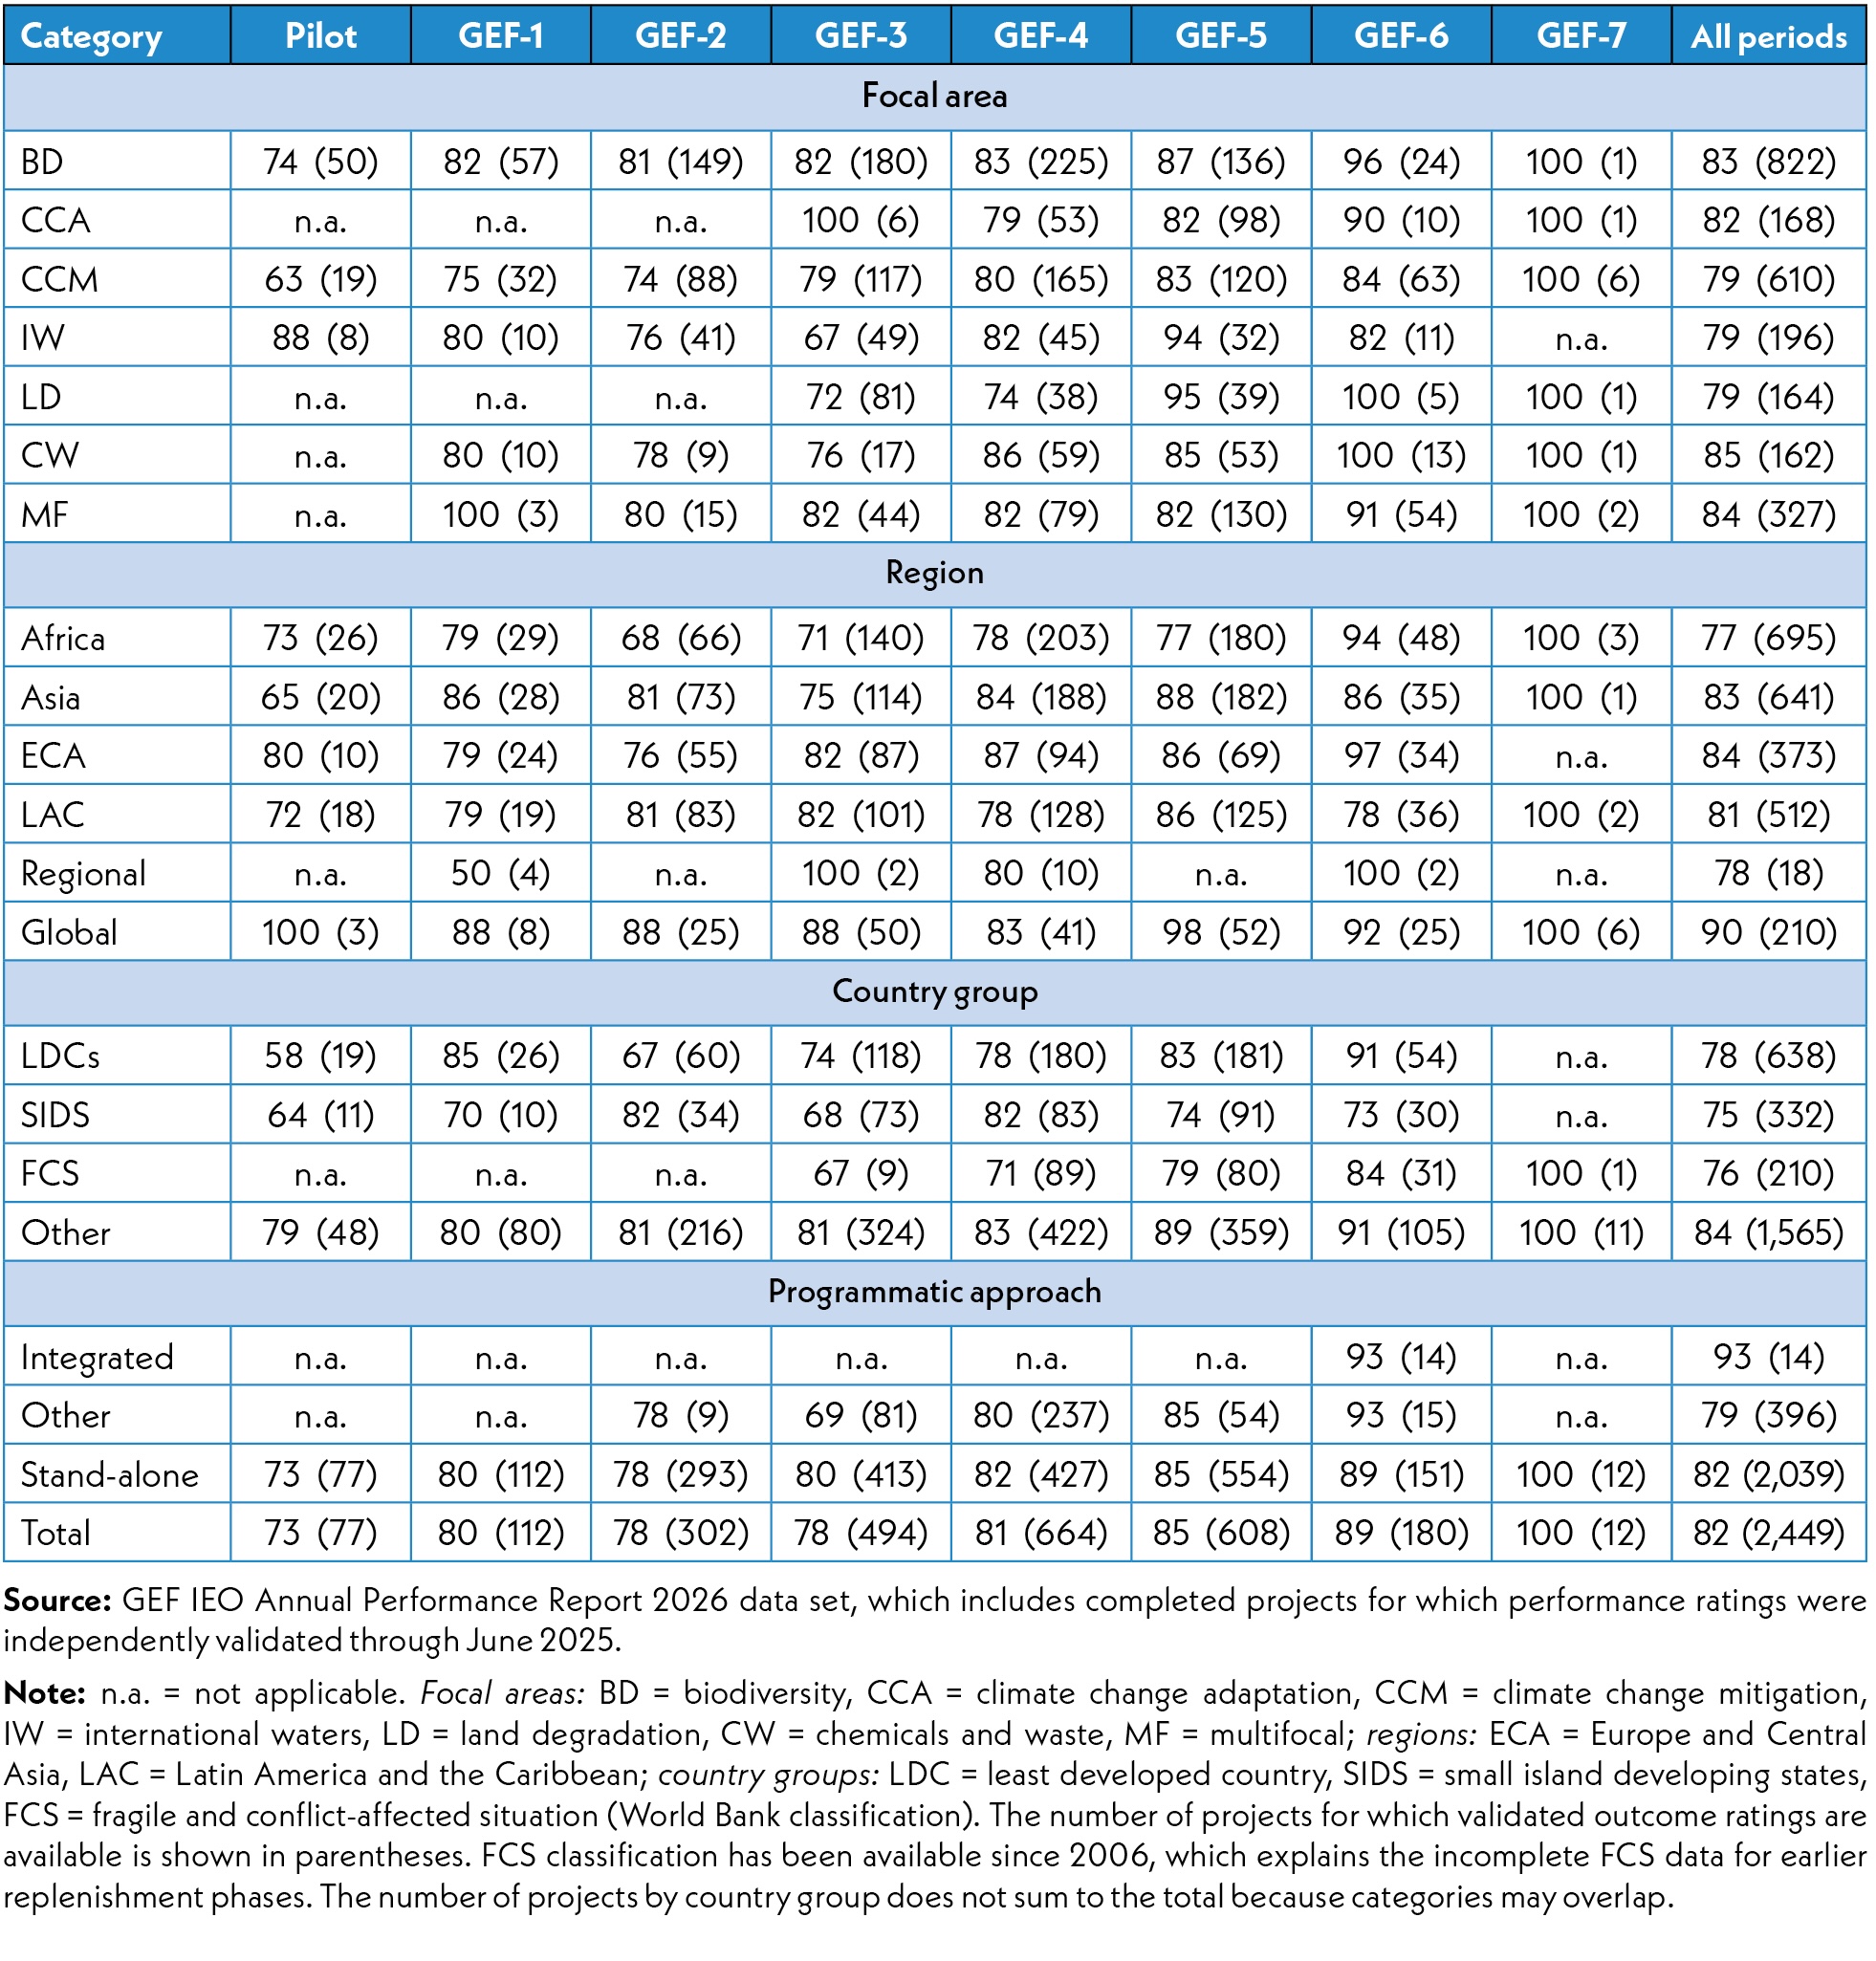
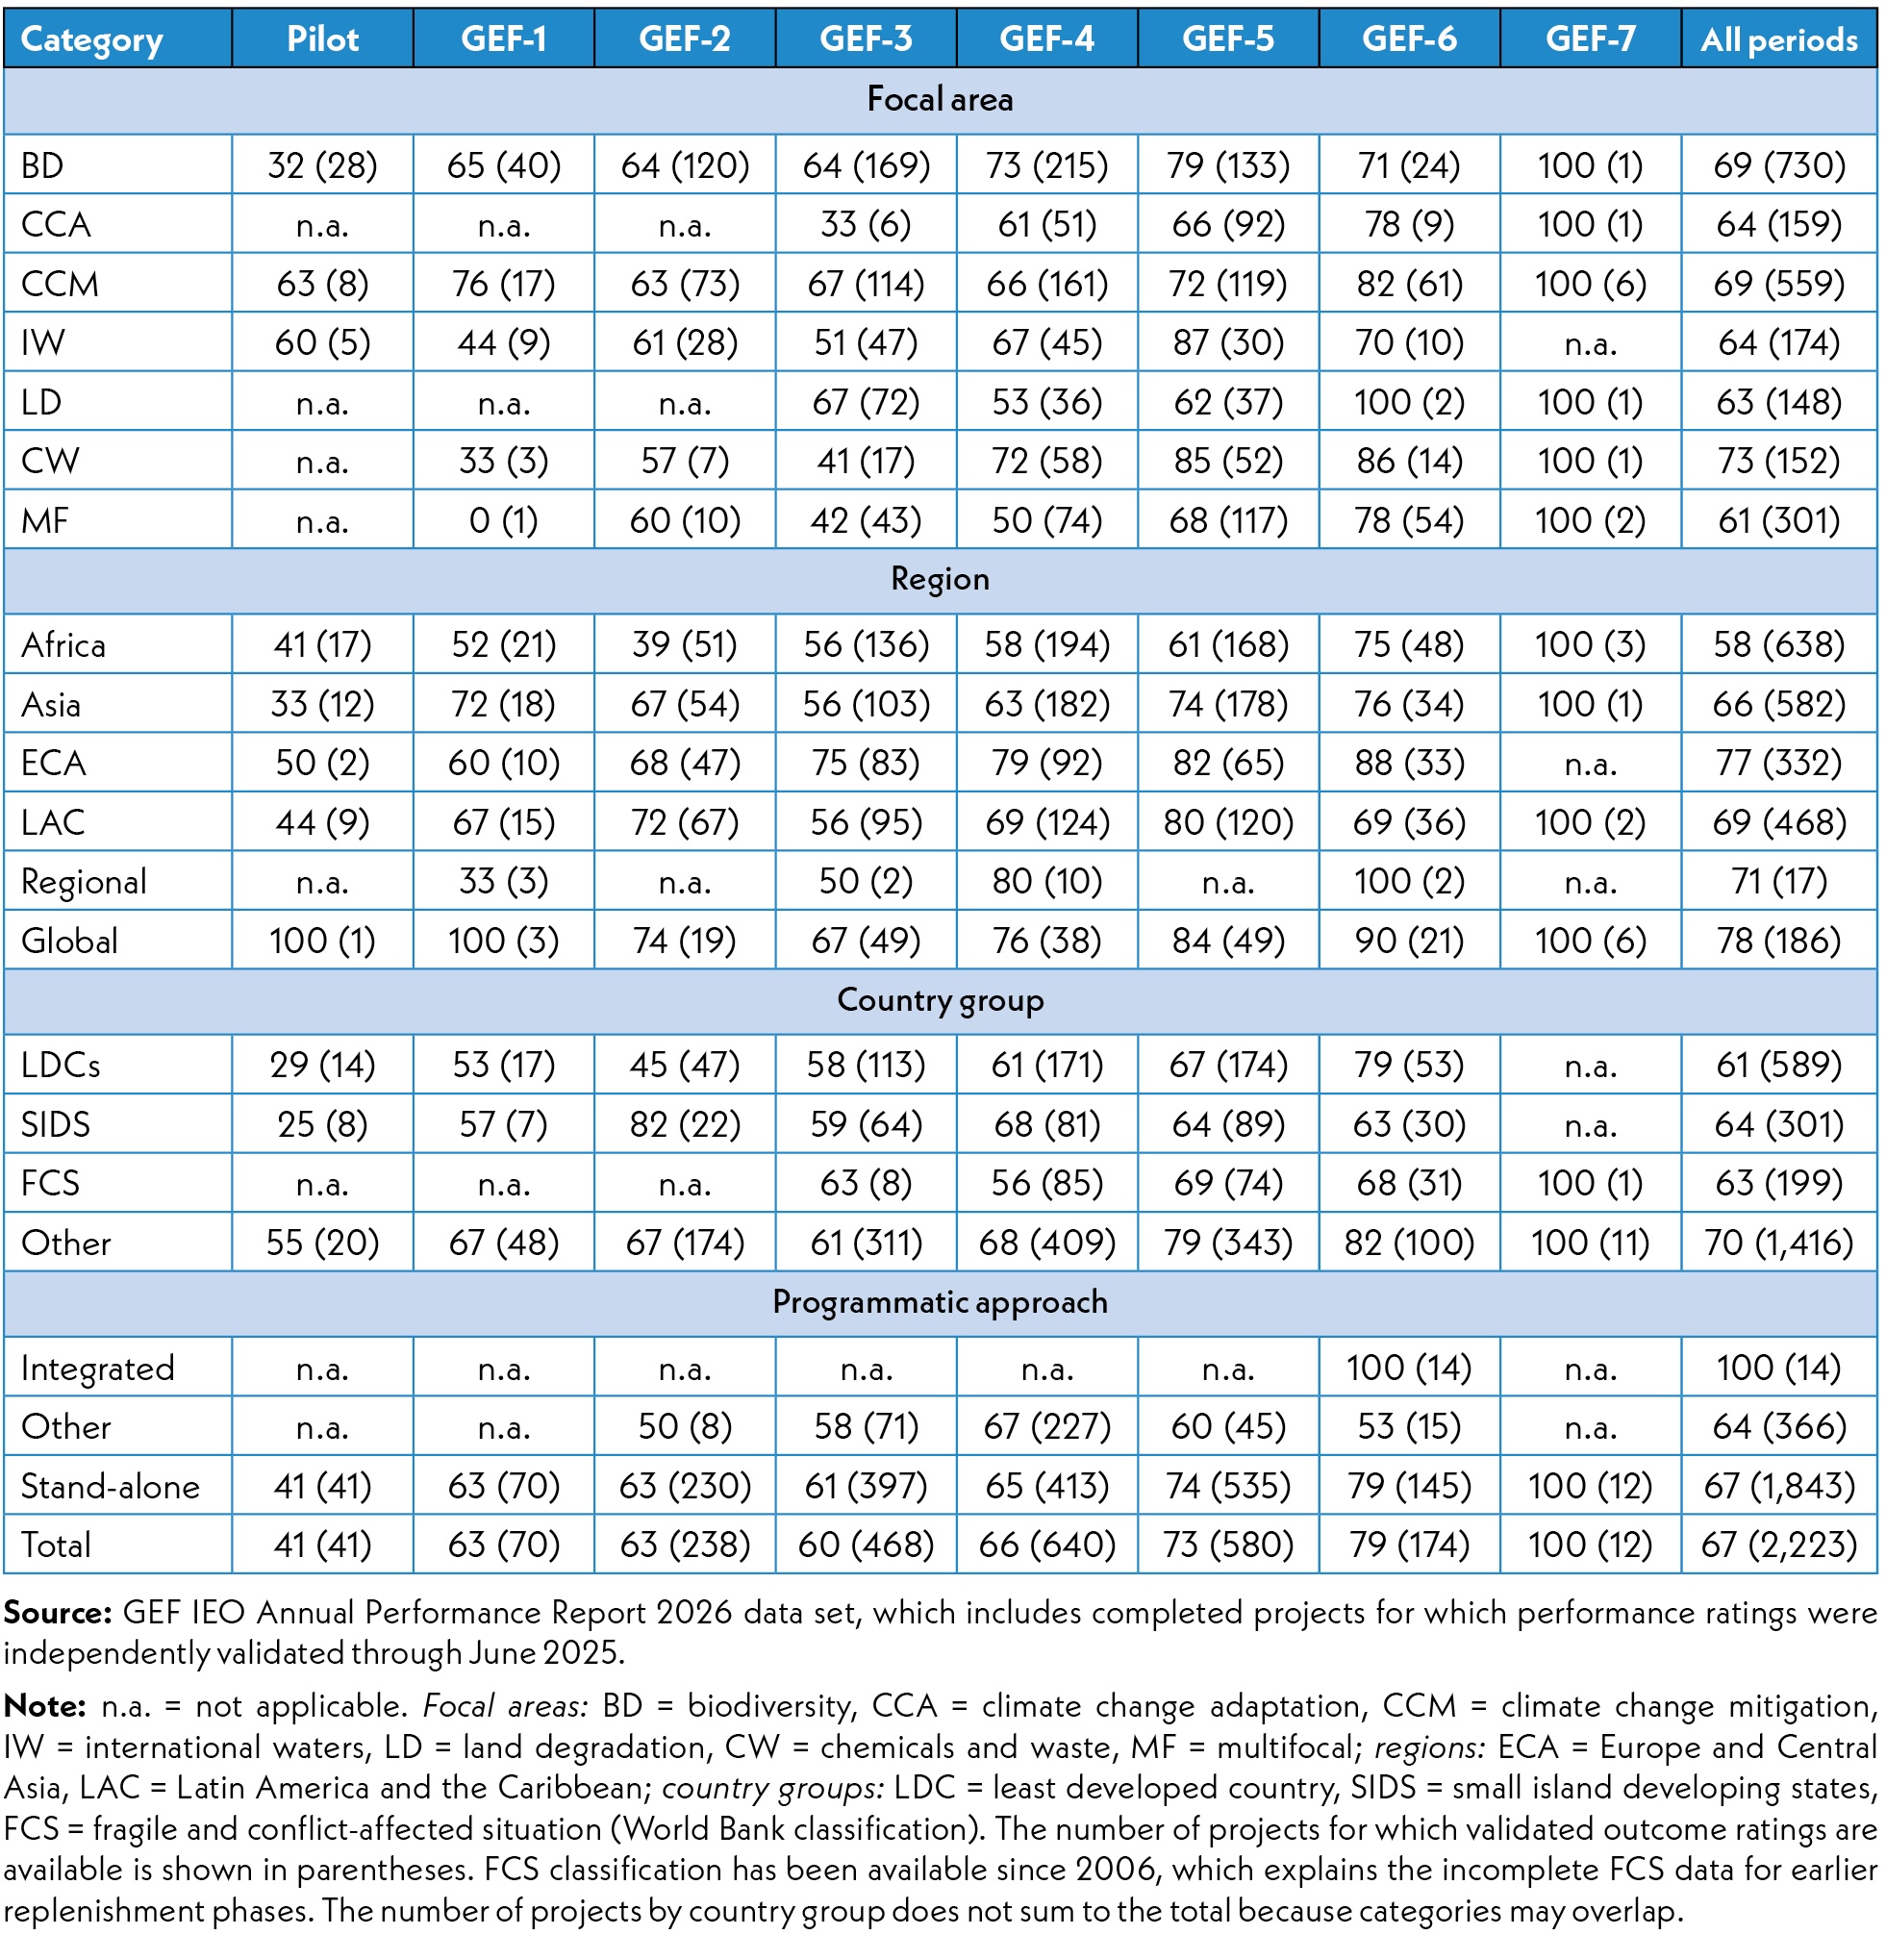
Table D.19 Percentage of projects with outcomes rated in the satisfactory range by replenishment period
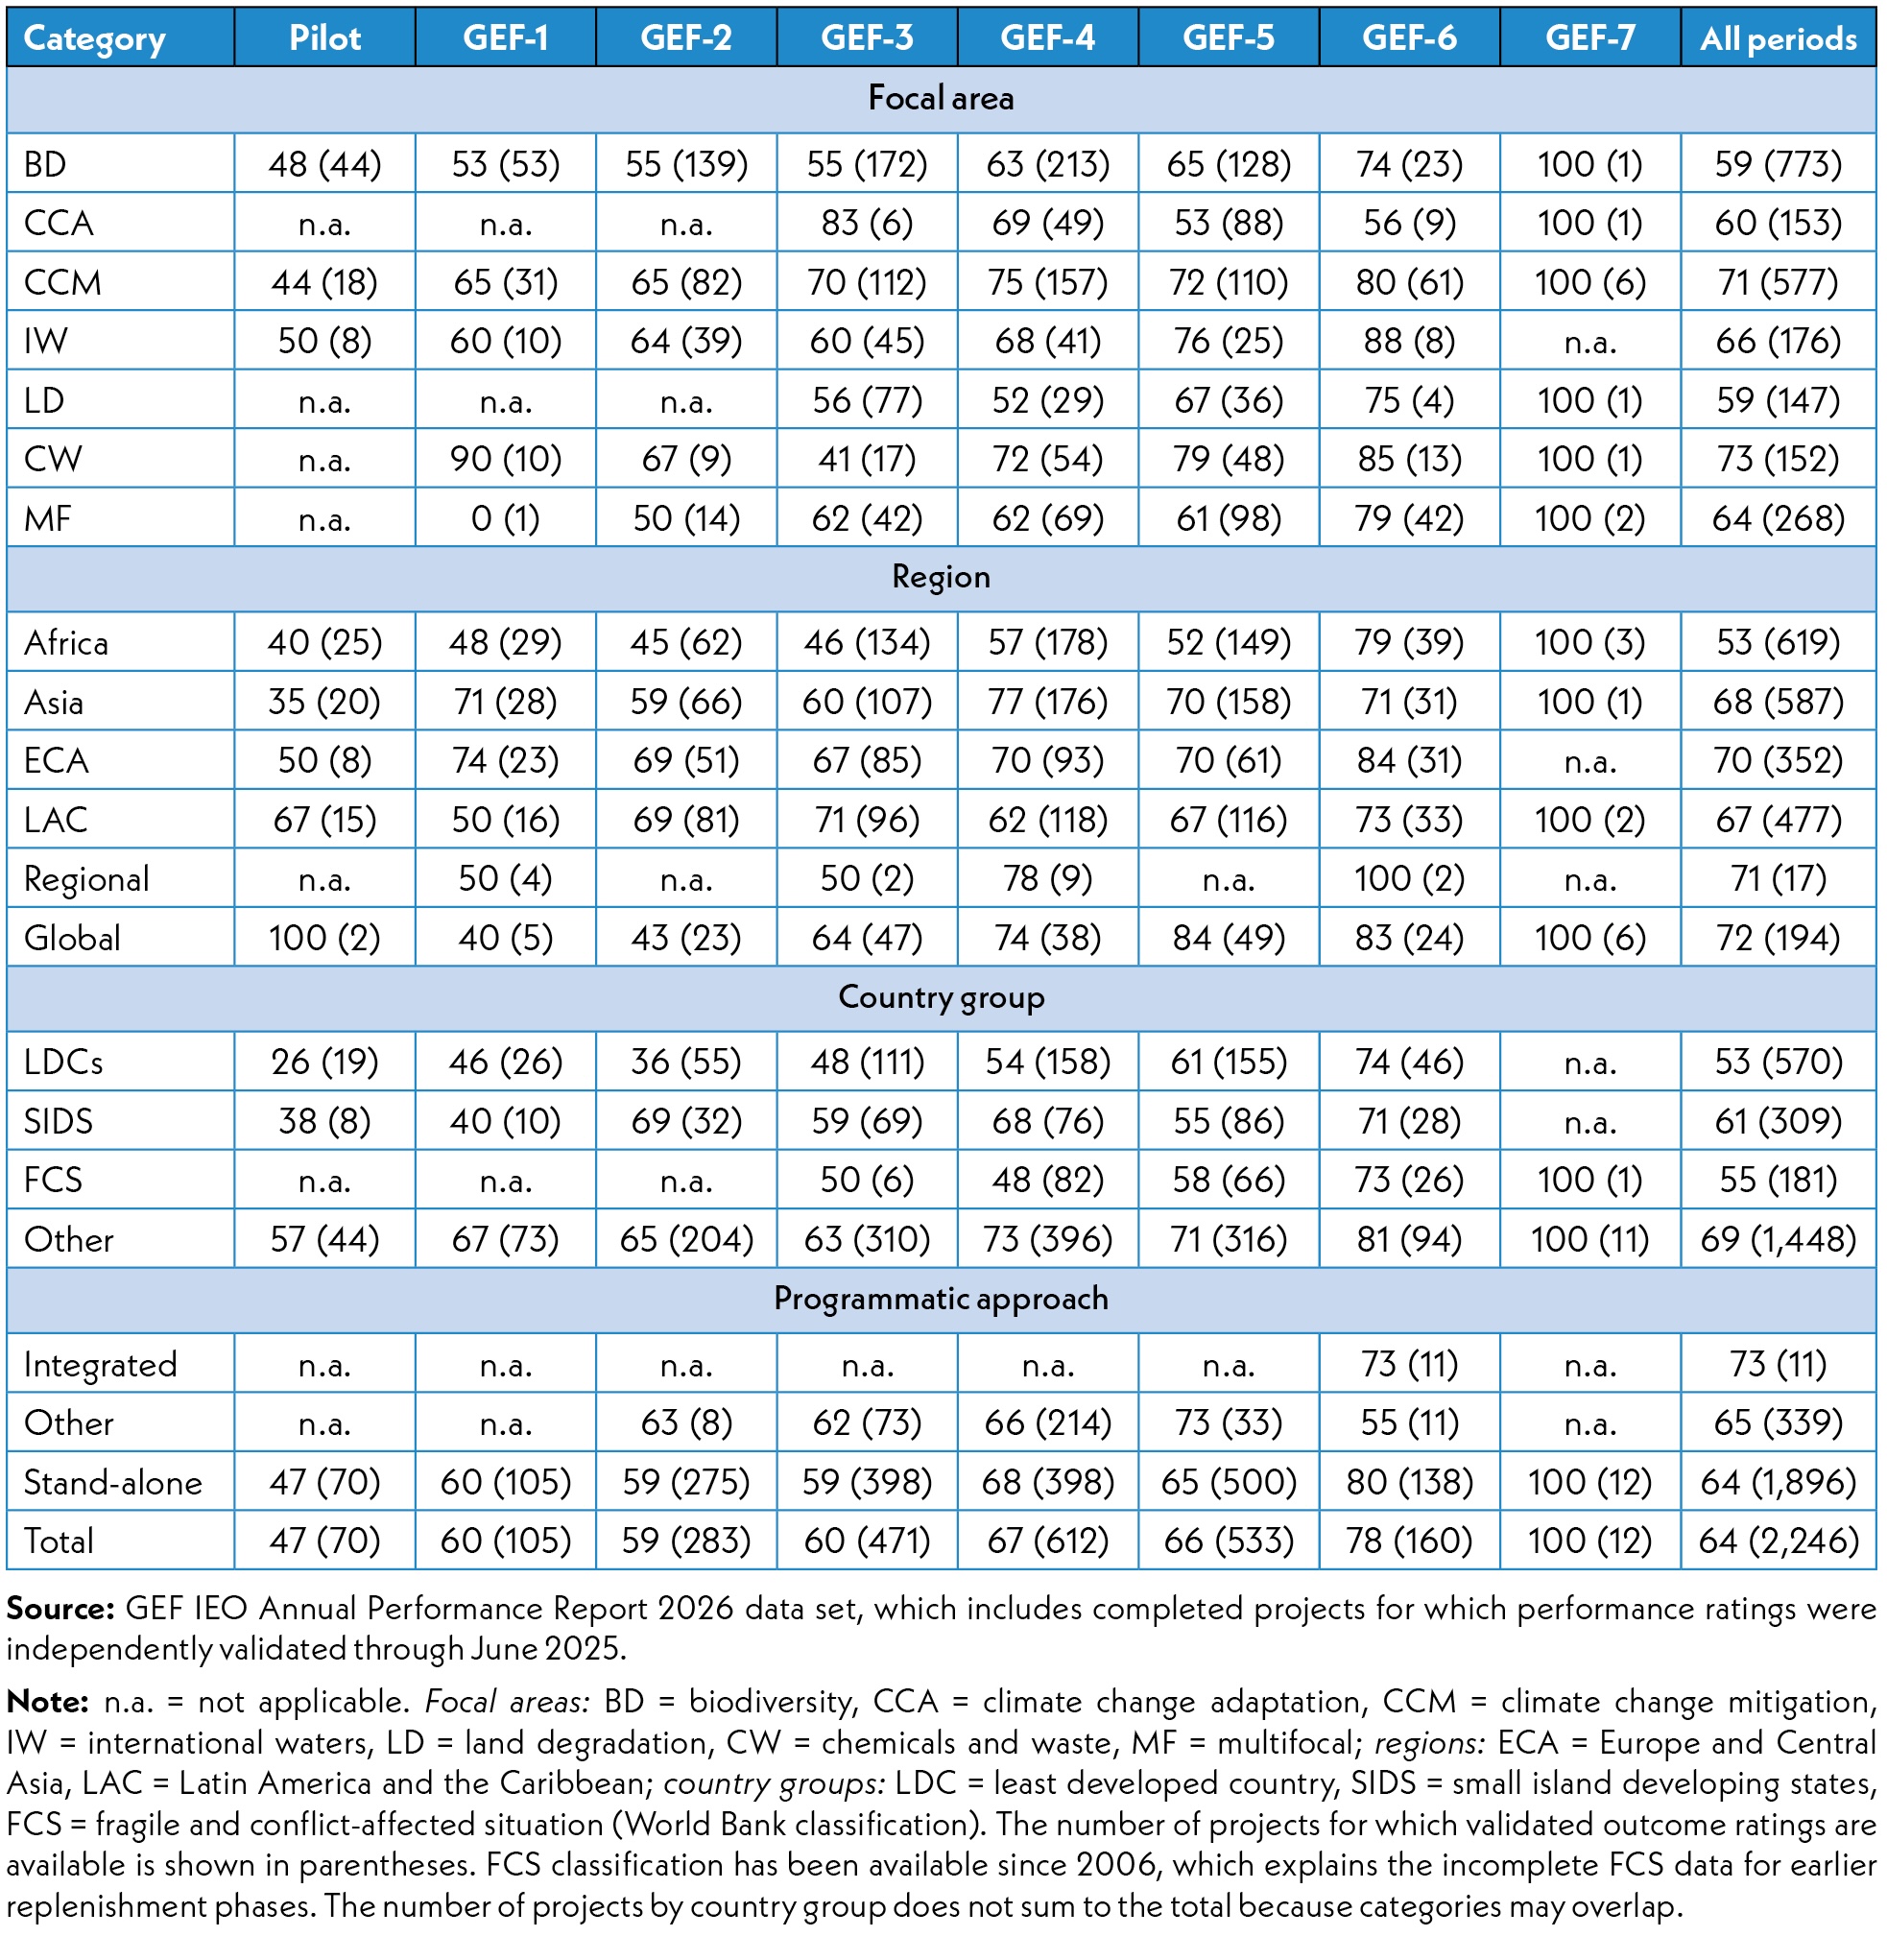
Table D.20 Percentage of projects with sustainability of outcomes rated in the likely range by replenishment period
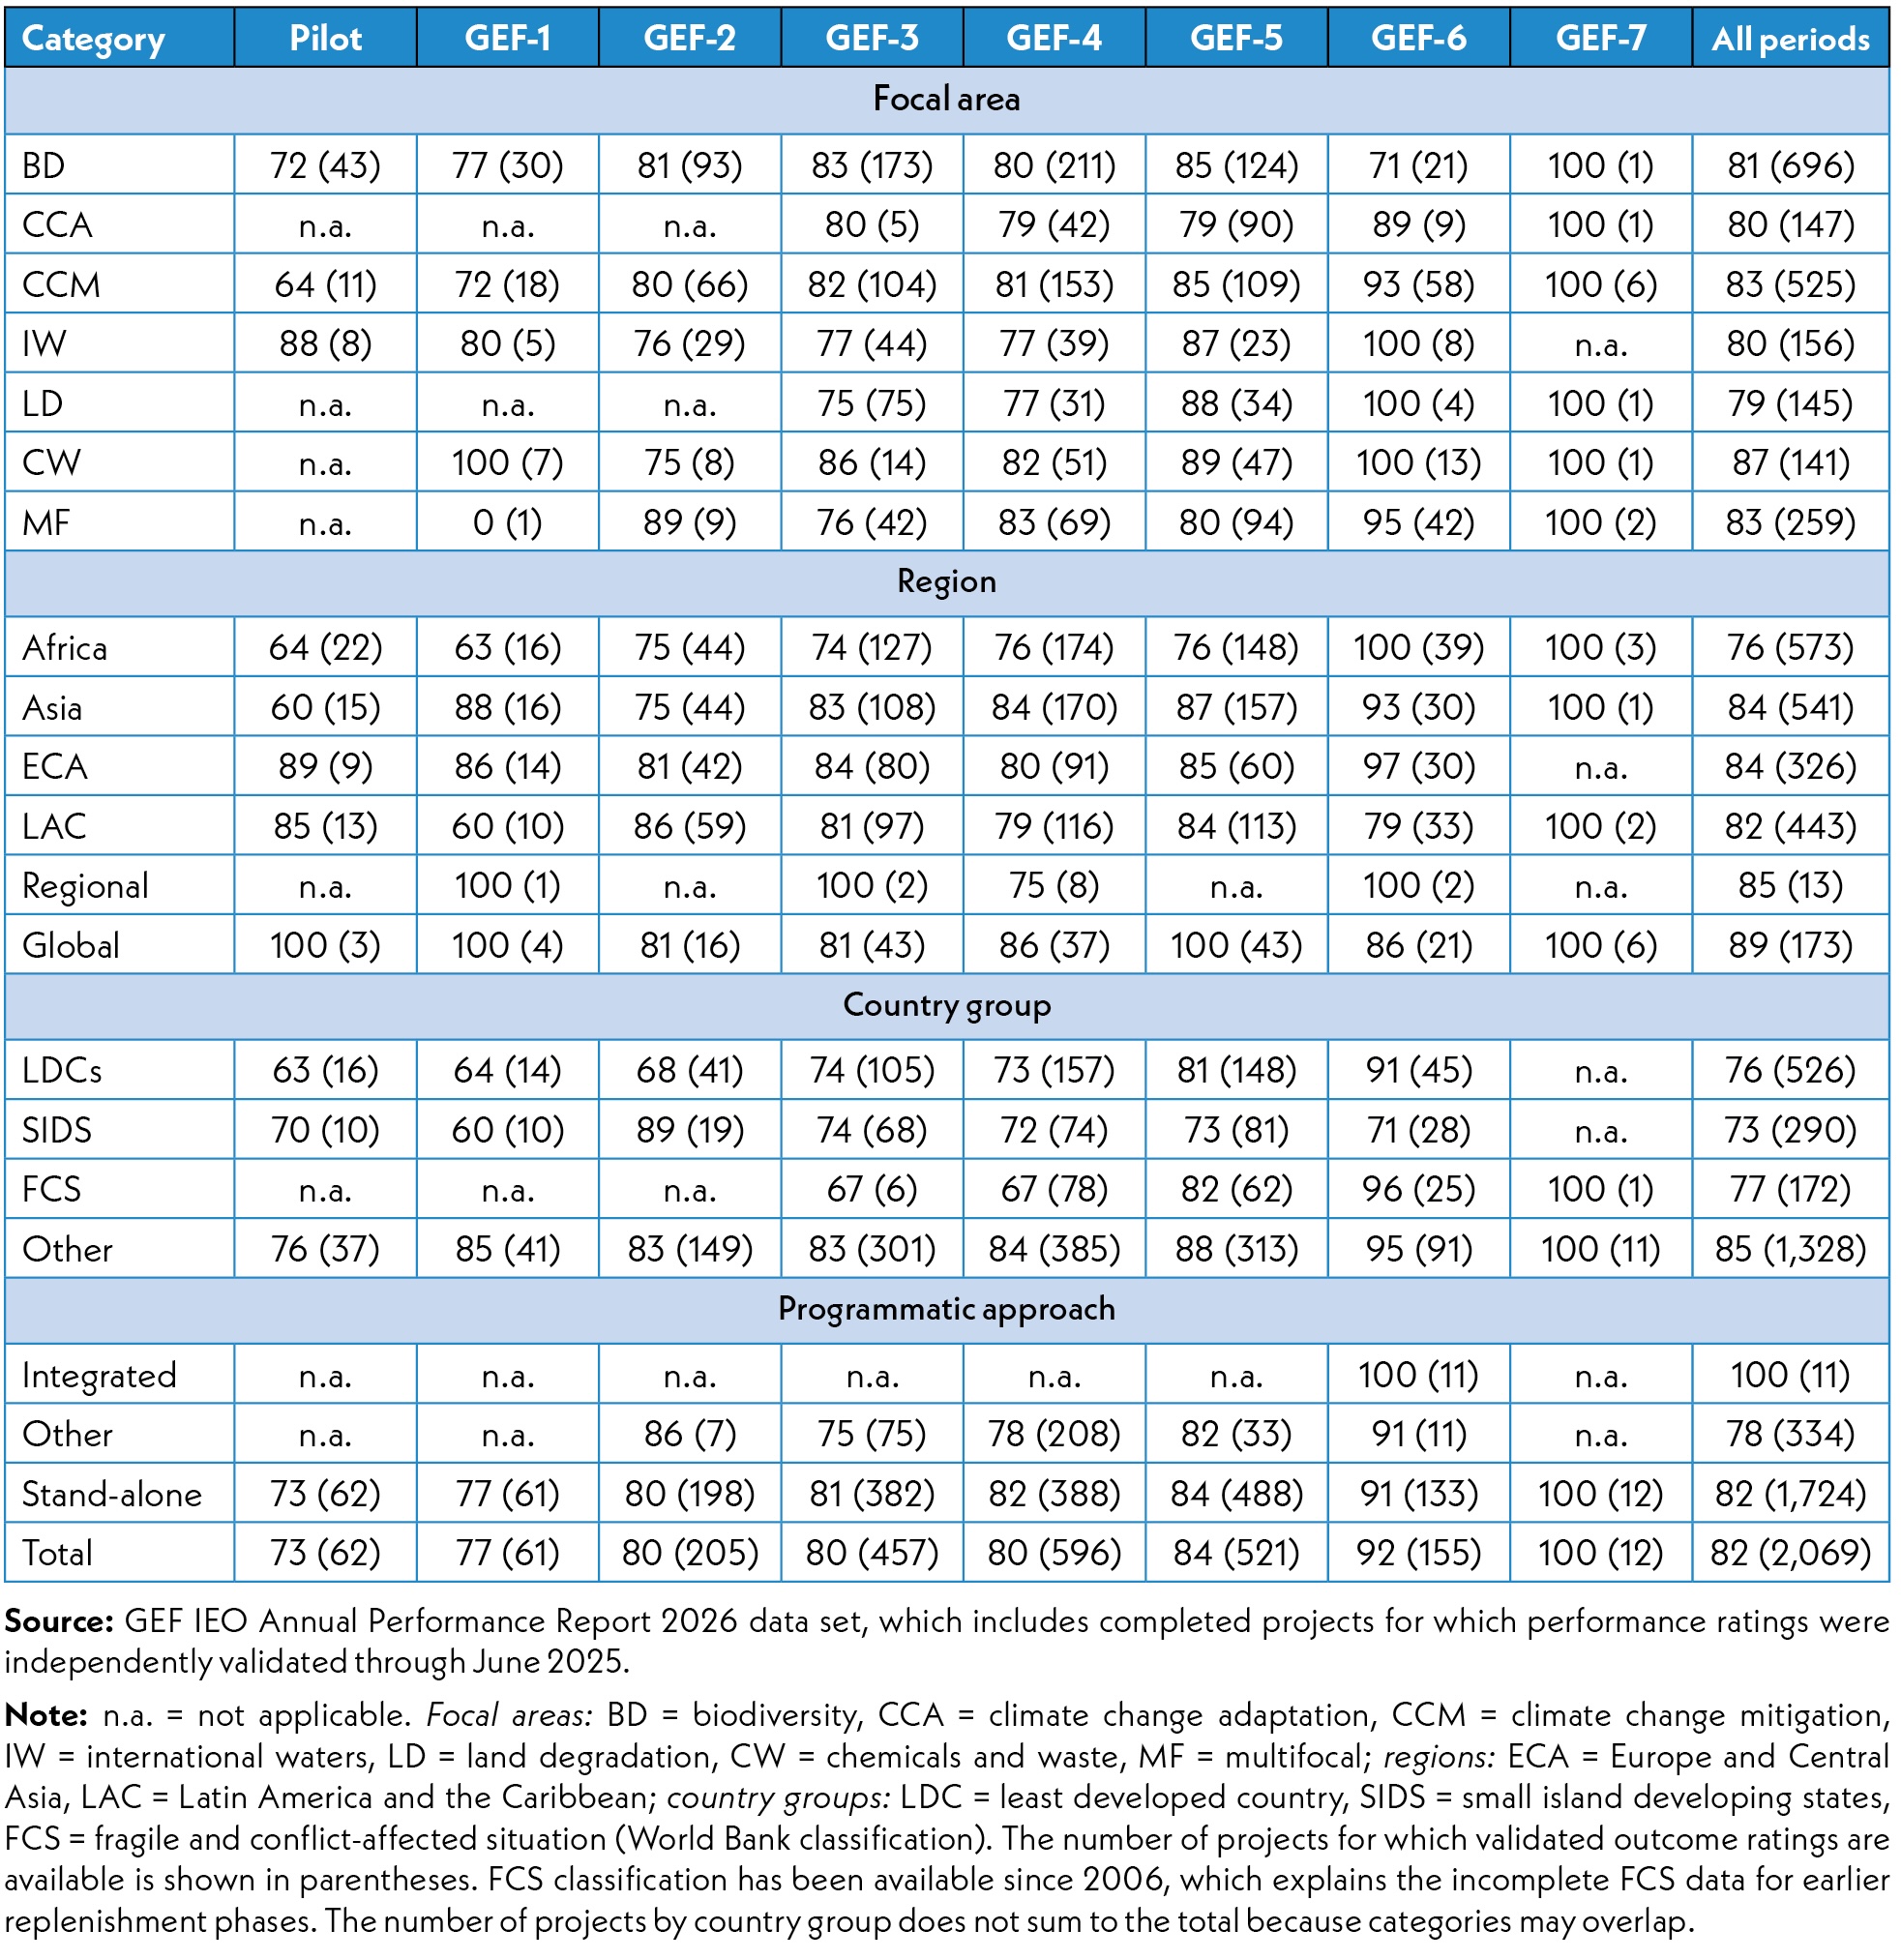
Table D.21 Percentage of projects with quality of implementation rated in the satisfactory range by replenishment period
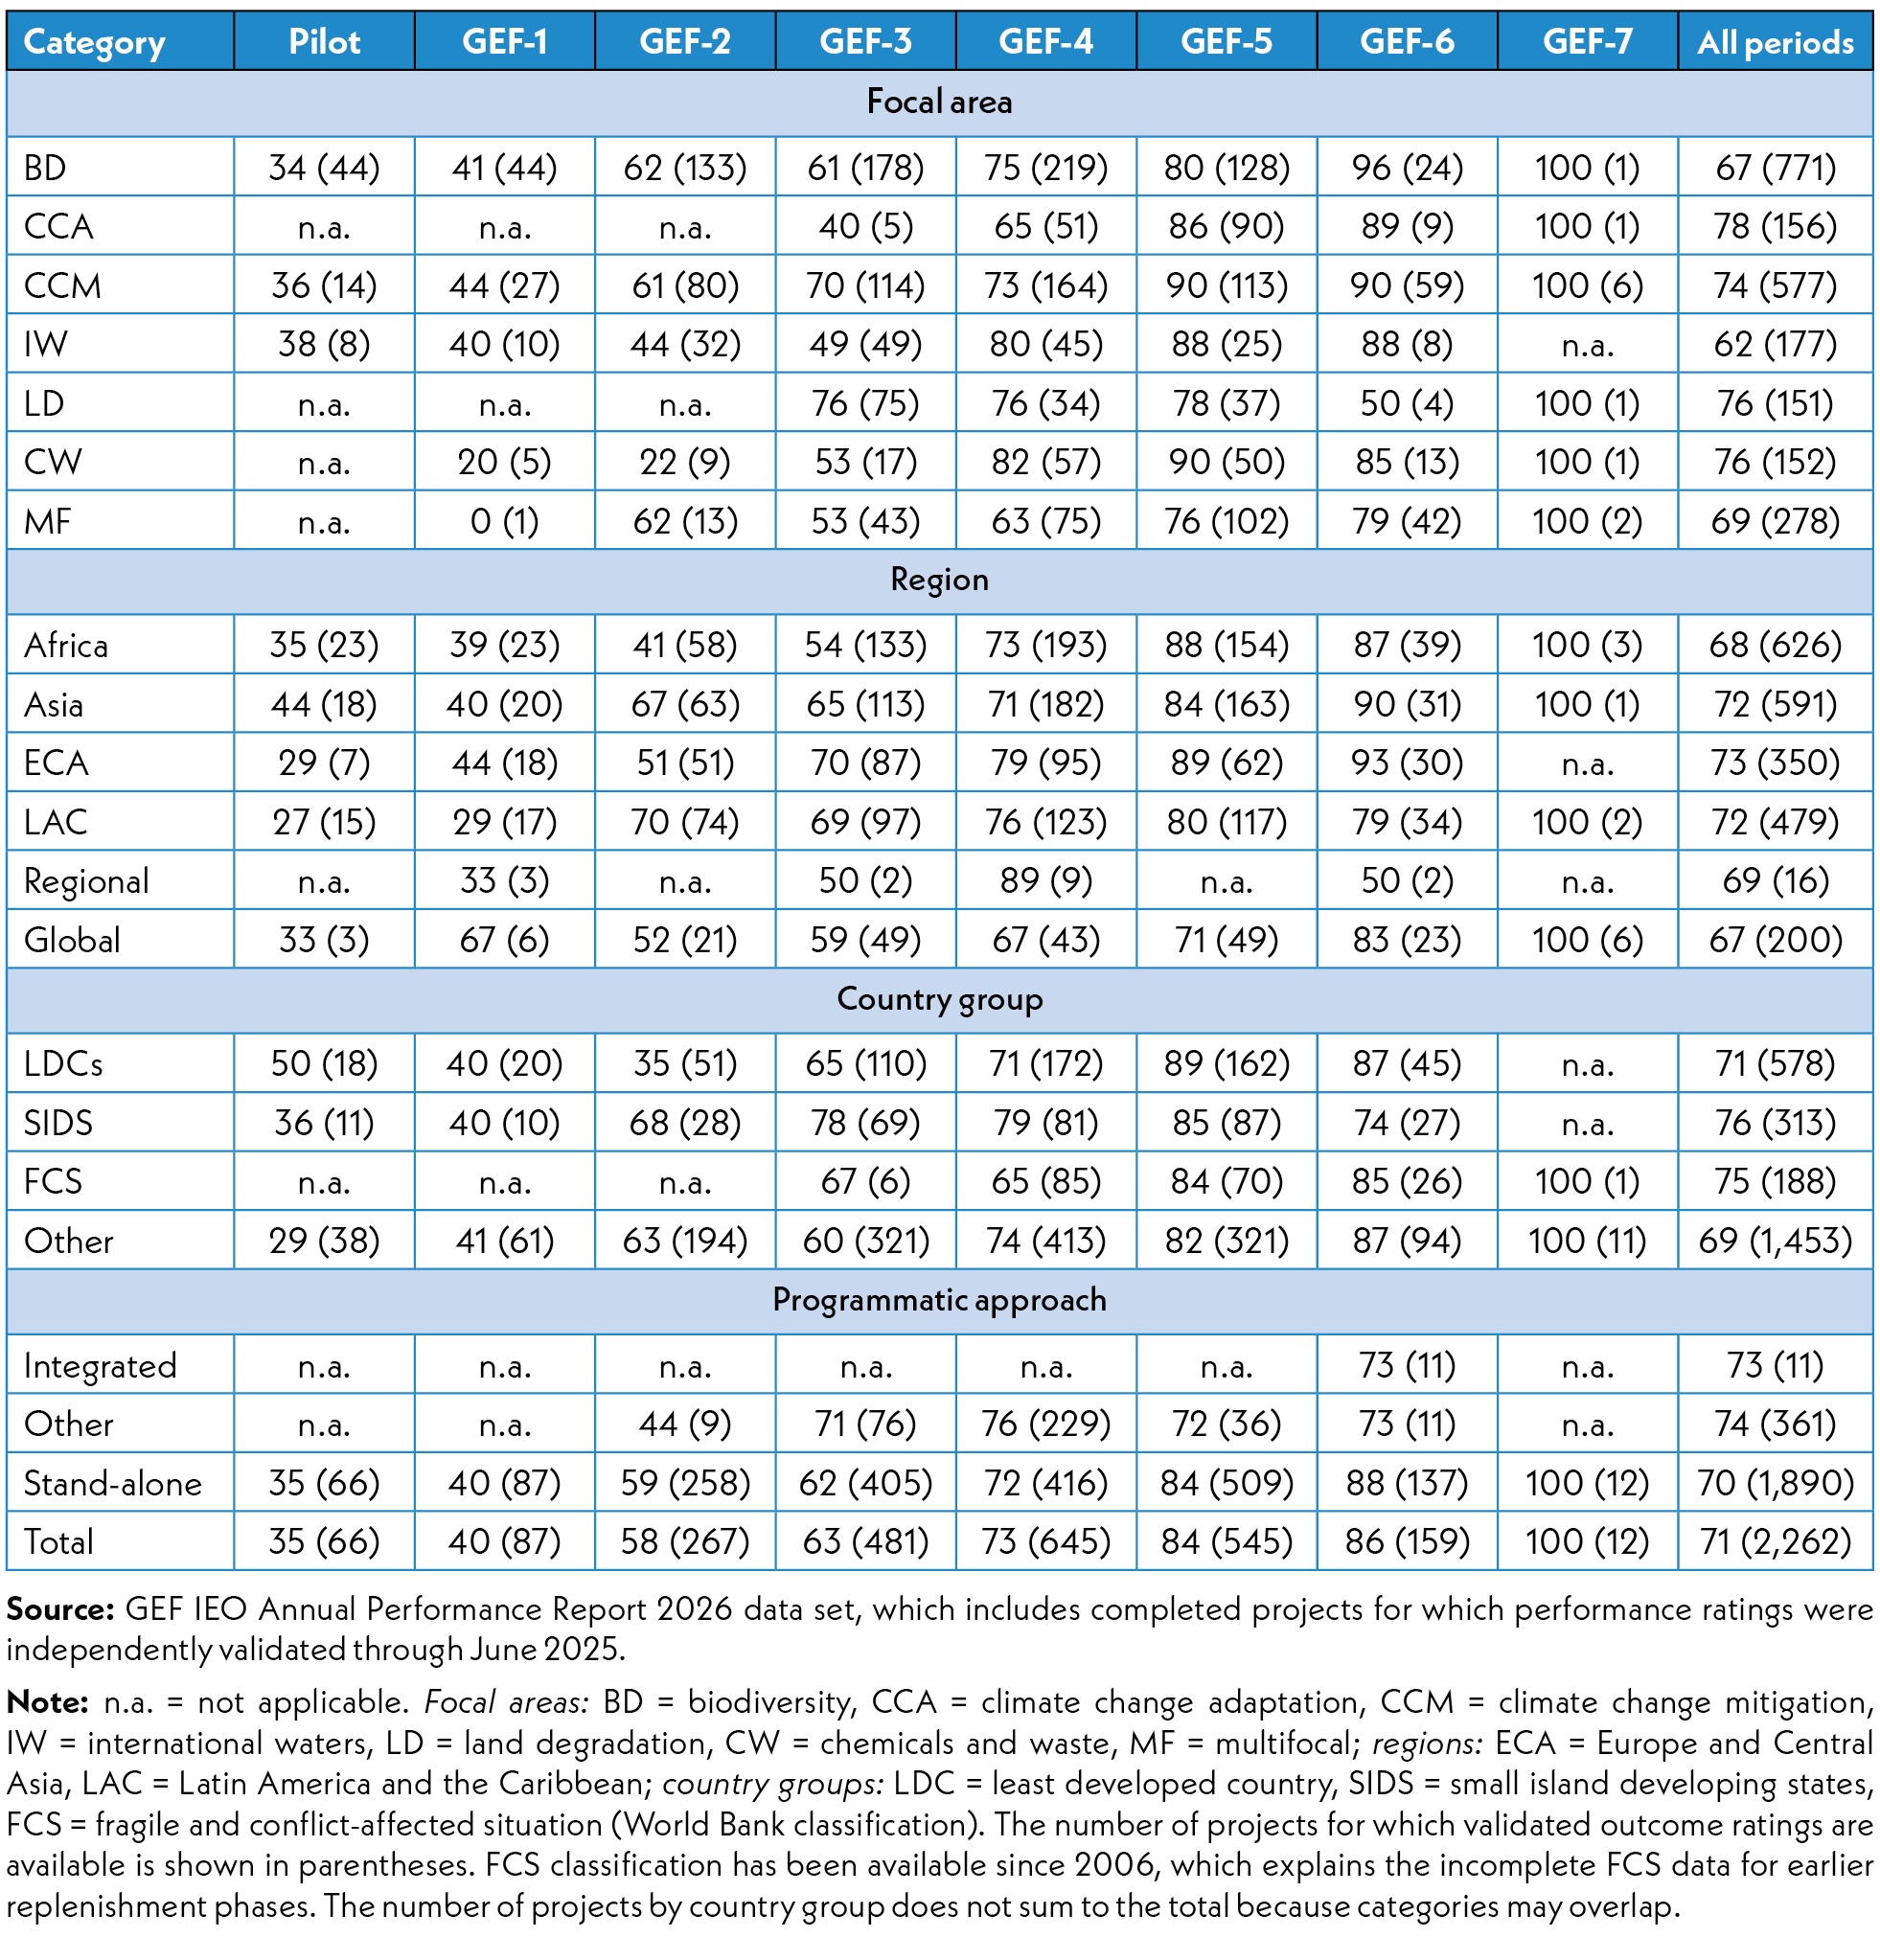
Table D.22 Percentage of projects with quality of execution rated in the satisfactory range by replenishment period
Table D.23 Percentage of projects with M&E design rated in the satisfactory range by replenishment period
Table D.24 Percentage of projects with M&E implementation rated in the satisfactory range by replenishment period
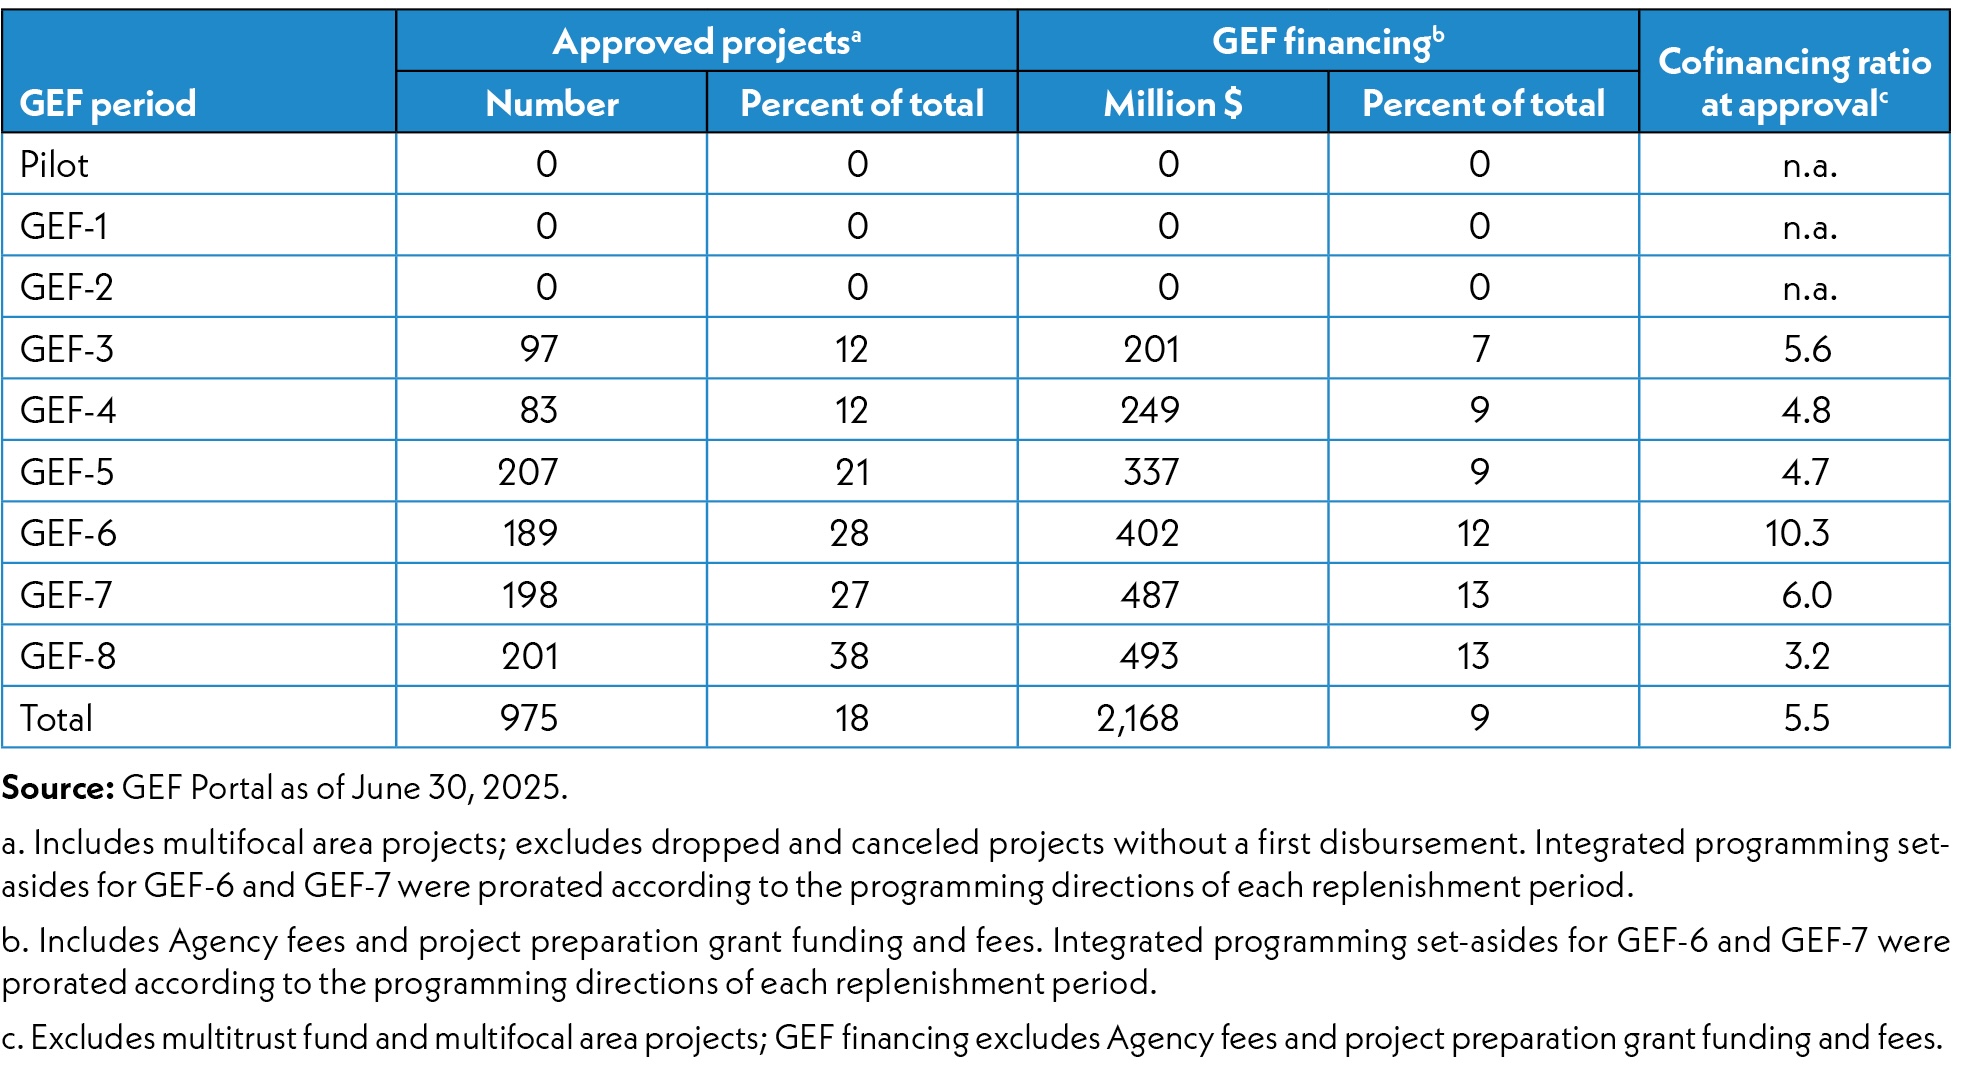
Table D.25 Overview of GEF Trust Fund biodiversity portfolio by replenishment period
Table D.26 Overview of Least Developed Countries Fund/Special Climate Change Fund climate change adaptation portfolio by replenishment period
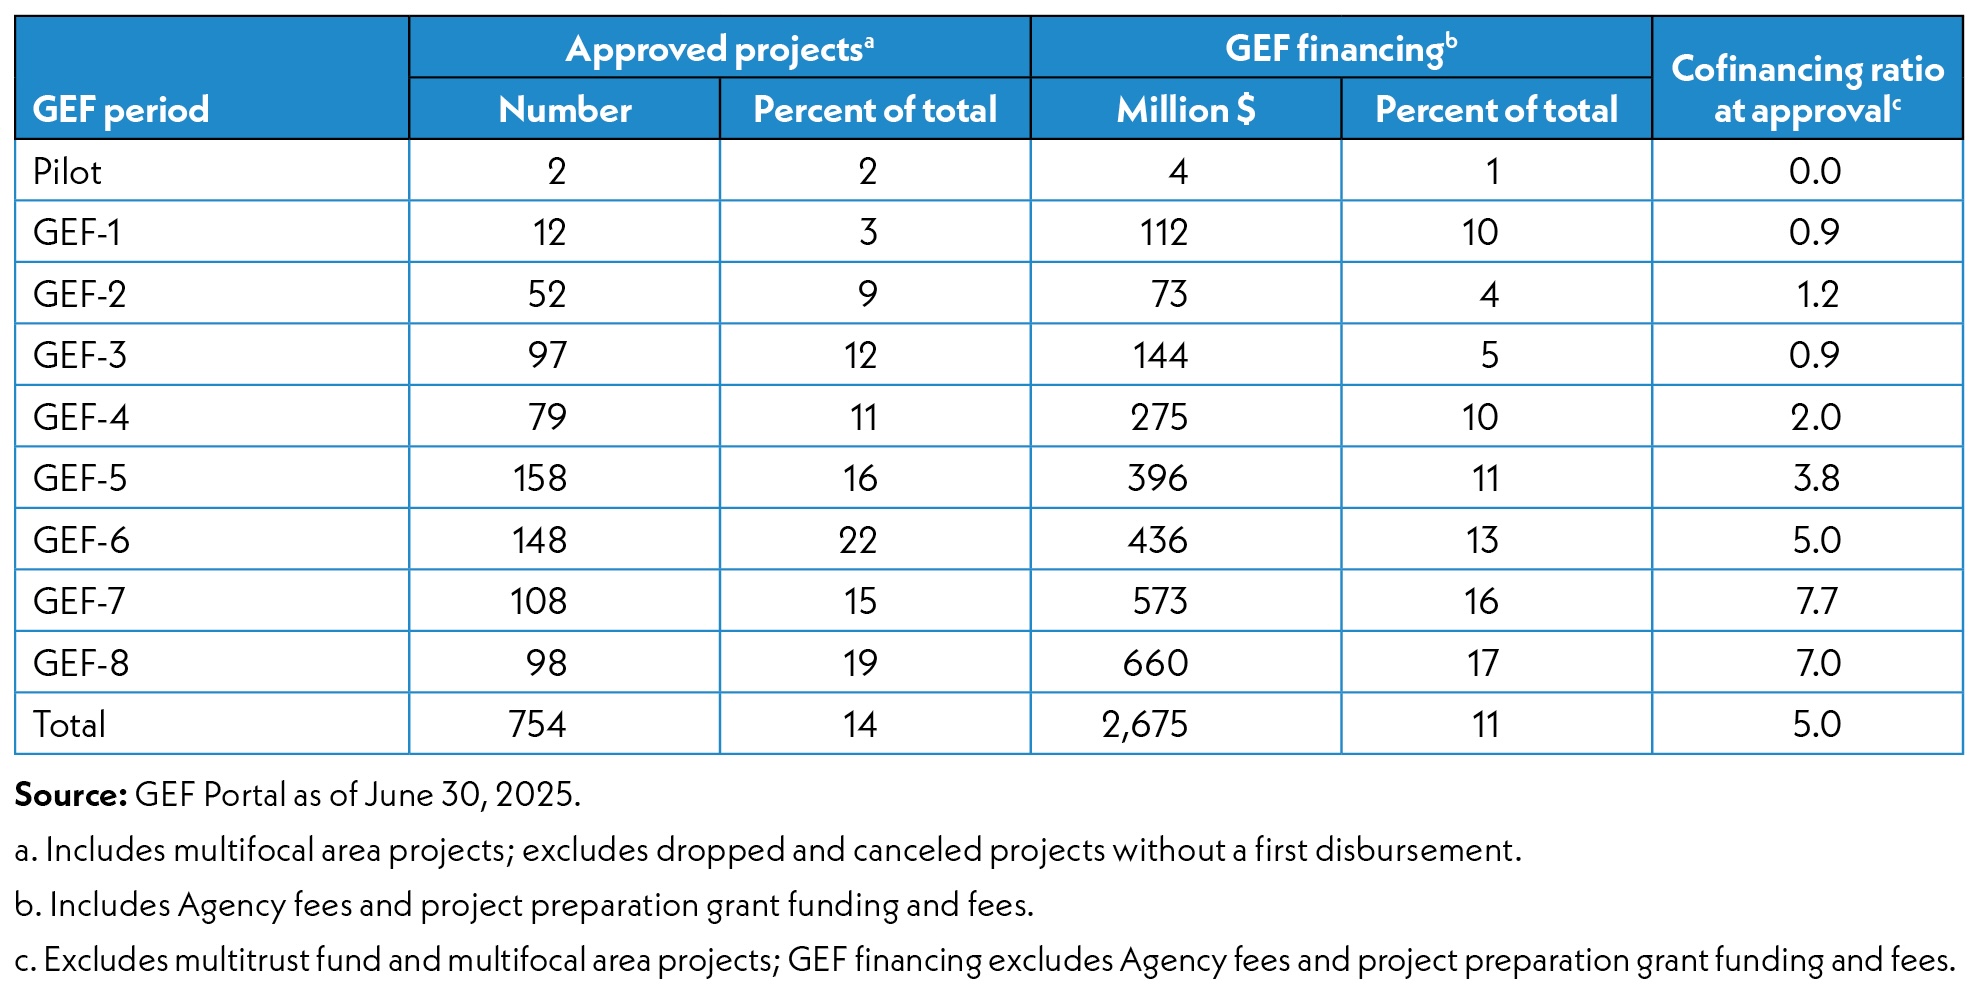
Table D.27 Overview of GEF Trust Fund climate change mitigation portfolio by replenishment period
Table D.28 Overview of GEF Trust Fund international waters portfolio by replenishment period
Table D.29 Overview of GEF Trust Fund land degradation portfolio by replenishment period
Table D.30 Overview of GEF Trust Fund chemicals and waste portfolio by replenishment period
Table D.31 Overview of GEF Trust Fund multifocal area portfolio by replenishment period