Integration for greater impact
Eighth Comprehensive evaluation of the GEF
With over three decades of experience, the Global Environment Facility (GEF) is a leading multilateral environmental fund that supports developing countries in prioritizing and implementing environmental actions that deliver global environmental benefits. The GEF’s mandate covers a broad range of environmental areas primarily tied to the 1992 Rio conventions and other multilateral environmental agreements: specifically, biodiversity, climate change, international waters, land degradation, and chemicals and waste. According to the June 2025 GEF Corporate Scorecard, since its inception in 1992, the GEF has provided more than $23.0 billion in grants and mobilized an additional $149.0 billion in cofinancing for more than 5,000 projects in 170 countries (GEF Secretariat 2025).
The GEF Trust Fund is replenished every four years; these replenishments are informed by a comprehensive independent assessment of GEF results and performance. There have been seven such overall performance studies of the GEF so far. This Eighth Comprehensive Evaluation of the GEF (OPS8), performed by the GEF’s Independent Evaluation Office (IEO), aims to provide solid evaluative evidence drawn from 34 separate evaluations conducted since OPS7 to inform the negotiations for the ninth replenishment of the GEF (box 1.1).
Specifically, as established in the approach paper approved by the GEF Council in June 2024, the objective of OPS8 is to evaluate the progress made by the GEF since OPS7 and the extent to which the GEF is achieving the objectives set out in the GEF-8 Programming Directions (GEF Secretariat 2022a), and to identify potential improvements going into GEF-9.
The audience for OPS8 comprises the GEF donors, the GEF Council, the GEF Assembly, and the GEF partners—including the GEF Secretariat, the GEF Agencies, the GEF Scientific and Technical Advisory Panel (STAP), the convention secretariats and their conferences of the parties, the GEF–Civil Society Organization (CSO) Network—and project proponents from civil society, the public and private sectors, and the academic community.
This chapter of the OPS8 report sets the stage for understanding the evaluation by outlining its purpose, scope, approach, and methodology. It also provides essential background on the GEF as an institution, including progress made since OPS7. The chapter opens with a snapshot of the global environmental challenges and constraints the GEF must navigate—ranging from the unprecedented loss of ecosystems and biodiversity to climate change; chemical pollution; increasing pressure on forests, oceans, and wildlife; as well as persistent poverty, unemployment, social exclusion, and widening inequality.
As of end June 2025, the GEF had provided $26.5 billion in total funding for more than 6,000 projects through its family of funds. The GEF Trust Fund remains the primary source for GEF financing, contributing $23.5 billion across 5,505 projects (table 2.1). In total, the GEF has raised $146.3 billion in cofinancing pledges. During the GEF-8 cycle, this translates to $7.70 in cofinancing for every dollar of GEF financing (table 2.2).
GEF-8 is currently in progress and is scheduled to conclude in June 2026. As of end June 2025, the GEF had approved 76 percent of its target allocation for GEF-8, amounting to $3.9 billion for 525 projects.1 At the same stage of GEF-7, the number of approved projects and the percentage of resources programmed were comparable, with 557 projects accounting for 76 percent of the $3.9 billion funding target.2
Most focal areas and corporate programs in GEF-8 have a similar percentage of target allocations programmed as at the equivalent stage of GEF-7. However, resources for chemicals and waste and the Non-Grant Instrument (NGI) Program have been programmed at a faster pace in GEF-8. As of June 2025, no resources had been programmed for the Innovation Window.
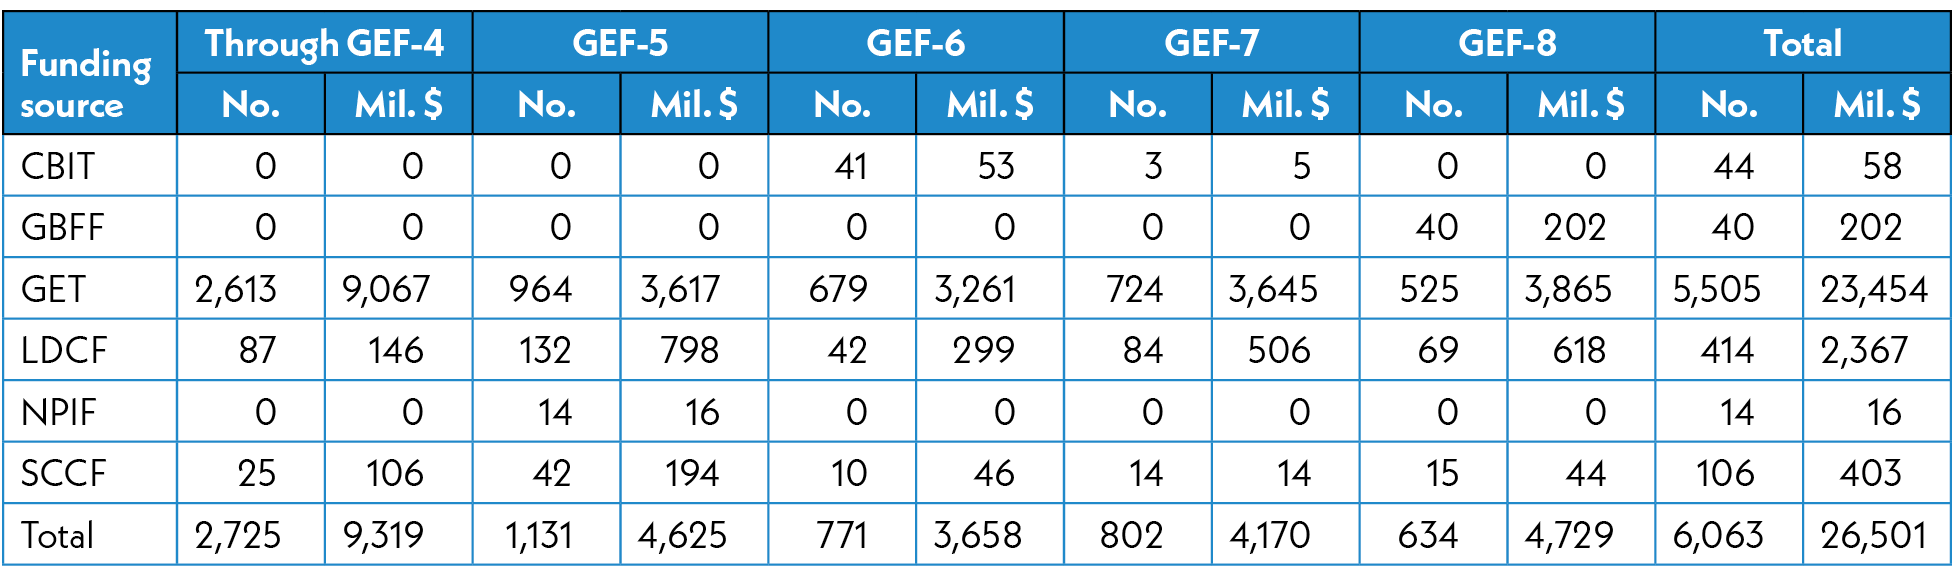
Sources: GEF Portal as of June 30, 2025. See table D.1 and table D.2.
Note: CBIT = Capacity-building Initiative for Transparency; GBFF = Global Biodiversity Framework Fund; GET = GEF Trust Fund; LDCF = Least Developed Countries Fund; NPIF = Nagoya Protocol Implementation Fund; SCCF = Special Climate Change Fund. The sum of projects by funding source may exceed the total number of projects because multitrust fund projects are counted in more than one funding source category. Totals include Agency fees and project preparation grant funding and fees.

Sources: GEF Portal as of June 30, 2025. See table D.3.
Note: n.a. = not applicable. CBIT = Capacity-building Initiative for Transparency; GBFF = Global Biodiversity Framework Fund; GET = GEF Trust Fund; LDCF = Least Developed Countries Fund; MTF = multitrust fund; NPIF = Nagoya Protocol Implementation Fund; SCCF = Special Climate Change Fund. Considers reported cofinancing when projects enter the work program. GEF financing excludes Agency fees and project preparation grant funding and fees.
Consistent with the GEF-8 Programming Directions, financing for biodiversity has increased, whereas the share allocated to climate change mitigation has declined (figure 2.1). Multifocal area interventions have gained greater prominence in GEF-8, both in terms of number of projects and resource allocation, reflecting the strategic focus on integrated programs (figure 2.2). In terms of planned cofinancing by focal area in GEF-8, international waters has the highest cofinancing ratio at 9.8, and land degradation the lowest at 3.2. Among corporate programs, the NGI Program shows the greatest cofinancing leverage, attracting $20.8 for every dollar of GEF financing; the Small Grants Programme (SGP) has a cofinancing ratio of 5.2.
Cumulatively, the United Nations Development Programme (UNDP), the World Bank, and the United Nations Environment Programme (UNEP) have accounted for significant shares of GEF Trust Fund resources: 35 percent, 26 percent, and 14 percent, respectively. However, individual Agency shares of GEF programming have shifted over time. In GEF-8, UNDP’s share declined to 29 percent, which represents a decrease from previous GEF cycles. The World Bank experienced an even steeper drop, with its share falling from 46 percent from the pilot phase until GEF-4 to just 8 percent in GEF-8. In contrast, the Food and Agriculture Organization of the United Nation’s (FAO’s) share has steadily grown across replenishment periods, increasing from 1 percent to 16 percent. Cofinancing ratios are highest for multilateral development banks (17.1) in GEF-8, compared with 6.8 for United Nations entities and 5.0 for others (figure 2.3).
Agency shares of GEF financing vary across regions. In Africa, UNDP, UNEP, and FAO receive the largest shares of funding. In Latin America and the Caribbean, governments primarily rely on UNDP, FAO, and UNEP, in that order, followed by Conservation International. In Asia, the predominant agencies are UNDP, FAO, and United Nations Industrial Development Organization, while in Europe and Central Asia, the leading agencies are UNDP, FAO, and the World Bank. For global programs, UNDP plays a dominant role, accounting for nearly half of the programmed financing in GEF-8 (table 2.3).
Overall, 12 percent of financing through the GEF Trust Fund has been delivered through child projects approved under the framework of integrated programs. In GEF-8 to date, integrated programs account for 38 percent of projects and 43 percent of the portfolio in terms of total financing (figure 2.4a). Historically, child projects under a programmatic approach have attracted more cofinancing than stand-alone projects. In GEF-8, projects under integrated programs have attracted lower levels of cofinancing than in previous periods, with a ratio of 7.6 compared to 10.6 in GEF-6 and GEF-7. Nevertheless, this remains higher than the 6.7 ratio observed for stand-alone projects (figure 2.4b).
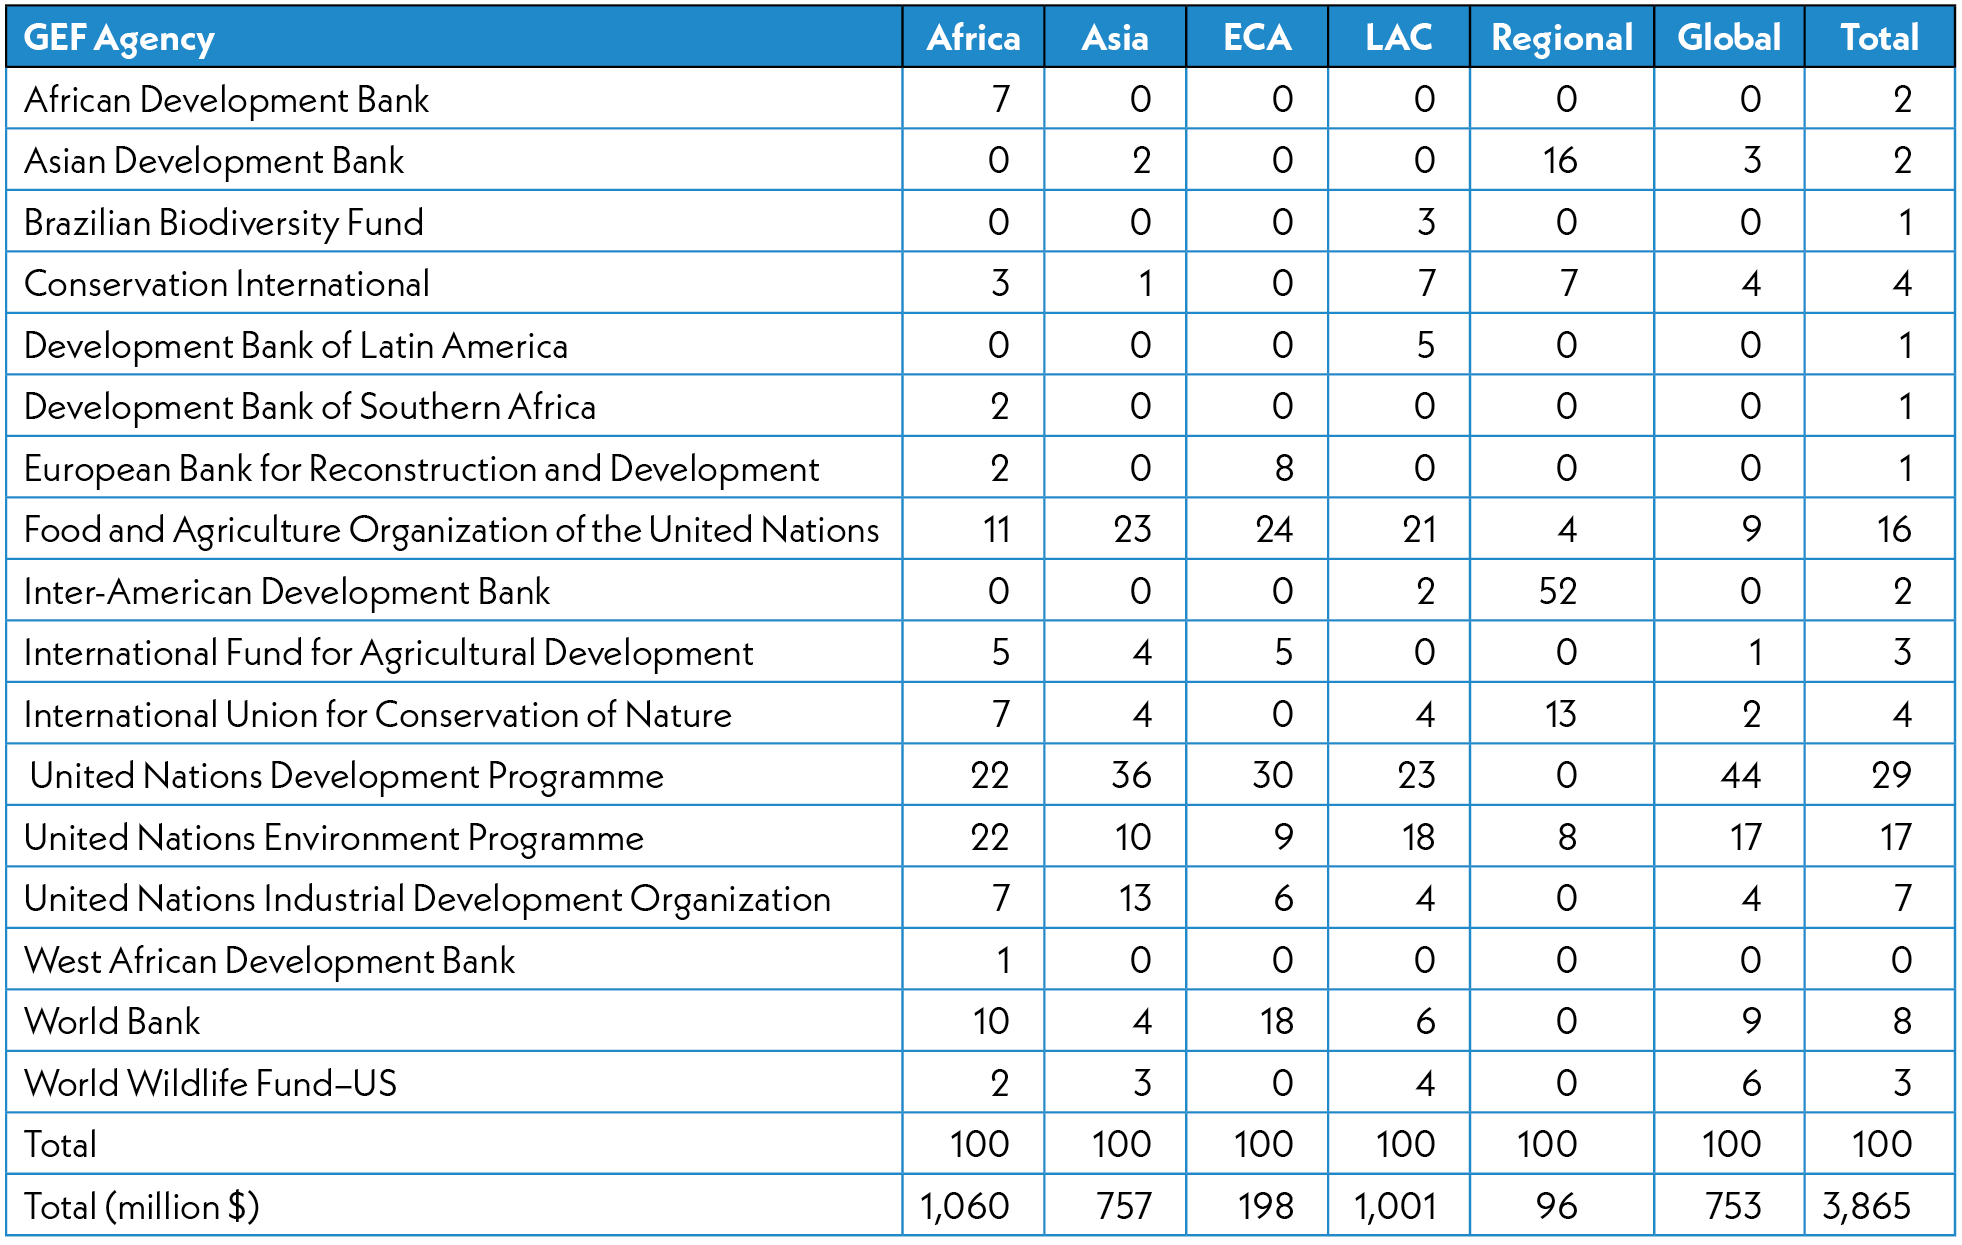
Sources: Source: GEF Portal as of June30, 2025. See table D.8.
Note: Details may not sum to totals because of rounding. GEF financing includes Agency fees and project preparation grant funding and fees. ECA = Europe and Central Asia; LAC = Latin America and the Caribbean.
Source: GEF Portal as of June 30, 2025. See table D.9 and table D.10.
Note: Considers reported cofinancing when projects enter the work program. In calculating cofinancing ratios, GEF financing excludes Agency fees and project preparation grant funding and fees. GEF-5 to GEF-7 figures are based on cumulative data.
The shares of financing for small island developing states (SIDS) and least developed countries (LDCs) has increased in GEF-8, continuing a trend that emerged in the later stages of GEF-7 (figure 2.5a). However, cofinancing remains a challenge for SIDS, with a ratio of 3.2—significantly lower than the 6.1 ratio observed for LDCs (figure 2.5b).
Africa and Asia have historically held the largest shares of total GEF financing. However, recent replenishment periods have shown notable shifts in regional distribution. In GEF-8, the shares for Africa and Latin America and the Caribbean have increased, with each region now accounting for slightly more than one-quarter of total GEF Trust Fund financing (figure 2.6a). In contrast, shares for Asia, and Europe and Central Asia have declined. The financing share for global projects rose from 15 percent in earlier periods to 18 percent in GEF-7, a trend that has continued into GEF-8. This increase is partially driven by the growing prominence of global projects implemented under integrated programs, along with a declining share of resources programmed through the System for Transparent Allocation of Resources (STAR). In terms of cofinancing, the Latin America and the Caribbean region has comparatively lower ratios, while Africa leads in cofinancing performance in GEF-8 (figure 2.6b).
Source: GEF Portal as of June 30, 2025. See table D.13 and table D.14.
Note: ECA = Europe and Central Asia; LAC = Latin America and the Caribbean. GEF financing ($10.5 billion for GEF-5 to GEF-7; $3.9 billion for GEF-8) includes Agency fees and project preparation grant funding and fees. Considers reported cofinancing when projects enter the work program. In calculating cofinancing ratios, GEF financing excludes Agency fees and project preparation grant funding and fees. GEF-5 to GEF-7 figures are based on cumulative data.
The top 10 recipients of GEF financing have remained largely unchanged since GEF-5. There have been some shifts in the rankings, however, with China falling from first to eighth place. Madagascar has joined the top 10, and Ecuador is no longer in the top 10 (figure 2.7).
Source: GEF Portal as of June 30, 2025. See table D.15 and table D.16.
Note: GEF financing includes Agency fees and project preparation grant funding and fees. Number of projects is shown in parentheses. GEF-5 to GEF-7 figures are based on cumulative data.
Cumulatively, 64 percent of GEF projects have been completed. Out of the 6,063 projects implemented across all GEF trust funds, 6 percent are in the preparation phase, and 29 percent are currently under implementation. The total number of completed projects stands at 3,904 (figure 2.8). According to the GEF Evaluation Policy, Agencies are required to submit terminal evaluations upon completion of full- and medium-size projects, as well as for enabling activities processed as full-size projects (GEF IEO 2022b). These evaluations are independently validated either by the GEF IEO or by the evaluation units of the implementing GEF Agencies. To date, 2,475 projects have submitted terminal evaluations to the GEF Portal3. Of these, 42 percent (1,032 projects) were independently validated by the GEF IEO, and 58 percent (1,443 projects) were validated by Agency evaluation units. The Eighth Comprehensive Evaluation of the GEF (OPS8) cohort includes 669 completed projects with terminal evaluations submitted after the OPS7 cycle.