Integration for greater impact
Eighth Comprehensive evaluation of the GEF
Integrated approaches within the GEF evolved over several replenishment periods. During GEF-2, it was acknowledged that while a siloed, focal area approach was appropriate in specific contexts, it often limited the potential to generate multiple global environmental benefits. From GEF-3 to GEF-5, there was a shift to developing multifocal area projects and programs, fostering greater collaboration and synergies across focal areas to address interconnected environmental challenges more effectively.
In GEF-6, the GEF launched three integrated approach pilots (IAPs). The IAPs sought to address the underlying drivers of environmental degradation and create synergies across global environmental commitments, aiming for more sustained and transformational impact. These pilots were Resilient Food Systems (RFS), focused on food security and ecosystem resilience in Sub-Saharan Africa; Sustainable Cities, targeting environmental pressures from rapid urbanization; and the Good Growth Partnership (GGP), aimed at reducing commodity-driven deforestation through sustainable supply chains. These pilots built on the GEF’s prior experience with large-scale, cross-cutting programs—such as Biodiversity Beyond National Jurisdiction, the Great Green Wall, and ridge to reef—as well as incentive-based mechanisms like the Sustainable Forest Management (SFM) and REDD+ programs.2
Building on the experience of the IAPs, GEF-7 launched three impact programs to further scale and deepen integration:3 the Food, Land Use, and Restoration (FOLUR) Impact Program, focused on sustainable food production and land use systems; the Sustainable Cities Impact Program, which expanded the initiative’s geographical coverage from municipal to metropolitan boundaries and sought to integrate biodiversity conservation into broader urban sustainability considerations; and the SFM Impact Program, which evolved from earlier periods to focus on transboundary forest ecosystems, including the Amazon and Congo Basin. According to the GEF-7 Programming Directions, the impact programs would support countries in promoting transformational change, consistent with their national development priorities, with better use of resources, through synergy and integration, and with increasing private sector contribution (GEF 2018a).
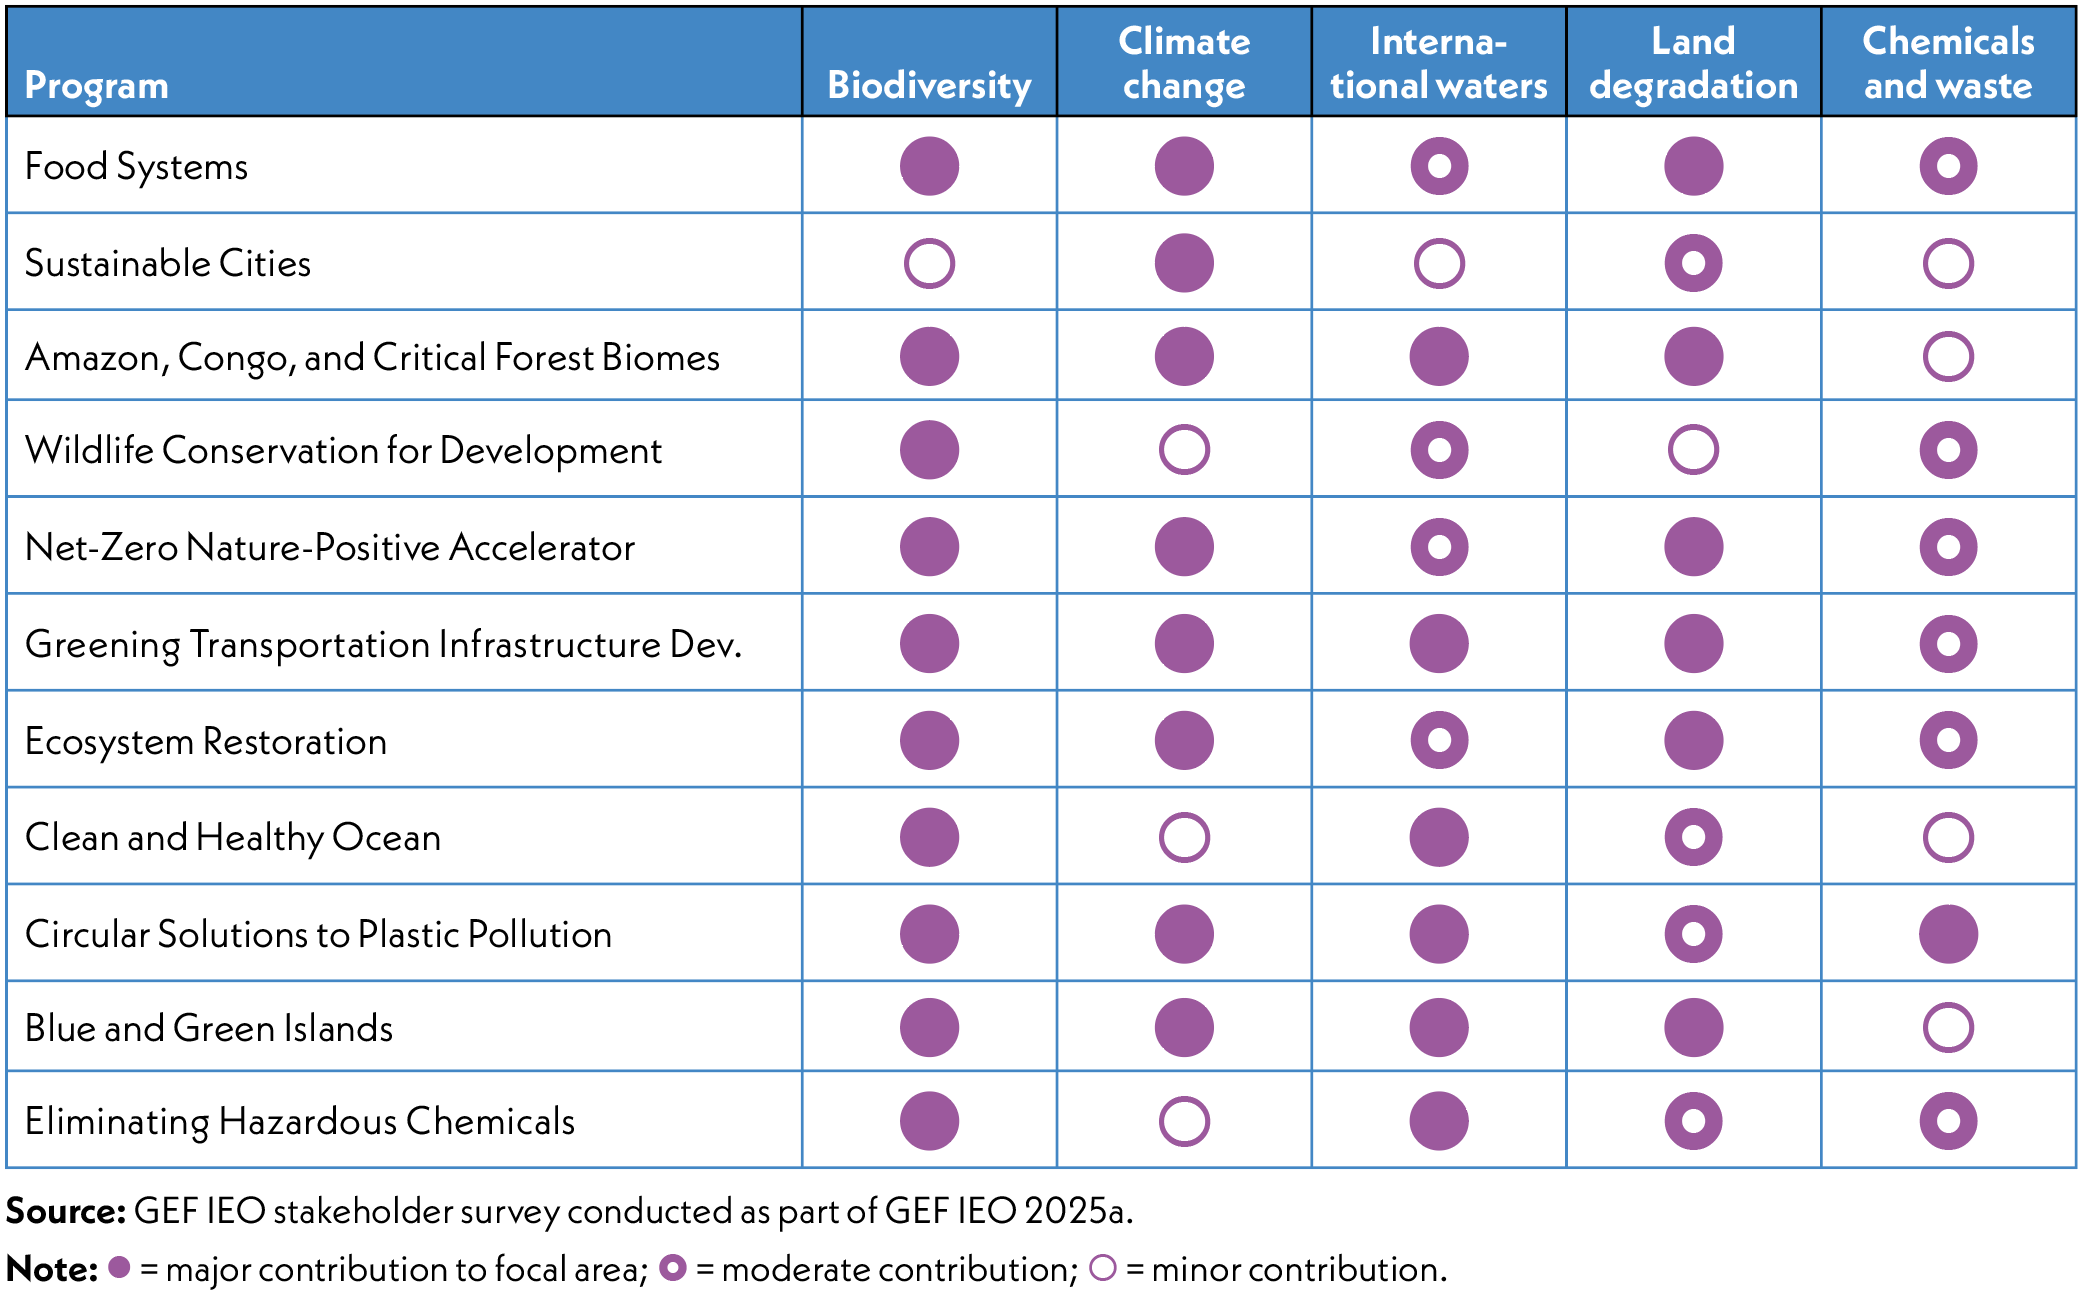
Under GEF-8, the number of integrated programs grew from 3 to 11. While maintaining a focus on food and land use, sustainable cities, and SFM, the GEF added thematic areas such as plastic pollution, ecosystem restoration, and a dedicated program covering five forest biomes, including the Amazon. The expansion was driven by the need for more comprehensive, cross-sectoral responses to multiple environmental crises. The 11 integrated programs are summarized in terms of their intended focal area contributions in table 6.1.
These six domains are key to the success and ultimate impact of integrated programming.
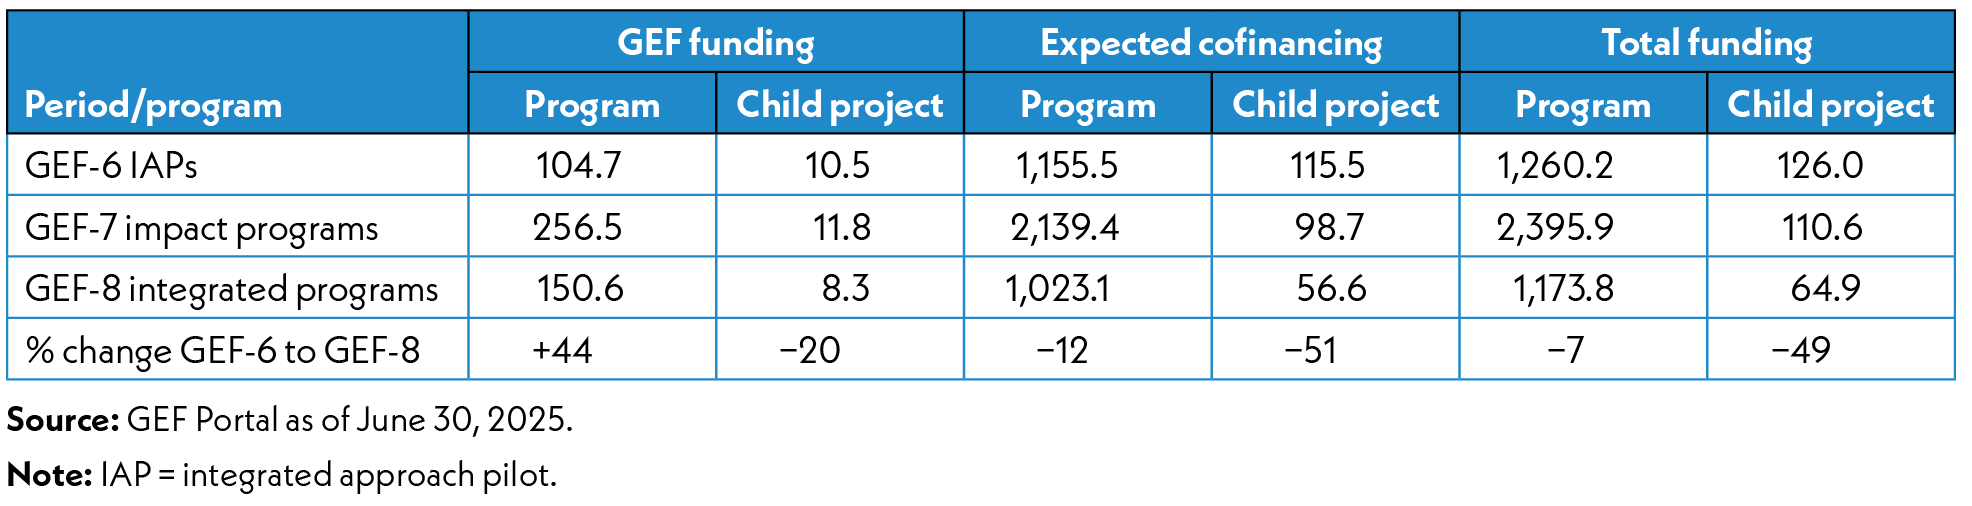
The progression from the GEF-6 IAPs to the GEF-7 impact programs and GEF-8 integrated programs reflects a significant amplification in financing, scope, and scale. Total GEF financing for integrated programming increased more than fivefold—from $314.1 million in GEF-6 to $1.657 billion in GEF-8. The number of child projects more than doubled from 30 in GEF-6 to 65 in GEF-7, and then tripled to 199 in GEF-8 (table 6.2).4 Notably, the average number of child projects per program increased from 10 in GEF-6 to 18 in GEF-8, reflecting broader coverage and diversification across themes.

The average financing per child project declined from GEF-6 to GEF-8. In nominal terms, average GEF funding per child project decreased by 20 percent—from $10.5 million to $8.3 million (table 6.3)—only slightly above the GEF-8 average of $7.6 million for all projects, including stand-alone ones. When expected cofinancing is considered, the decline in total notional financing per program and per child project is more pronounced. The most significant drop is in the average expected cofinancing and total funding per child project (−49 percent). It is important to note that cofinancing figures may shift as projects move toward Chief Executive Officer (CEO) endorsement. Factors explaining the decline include a change in the contribution from the System for Transparent Allocation of Resources (STAR) to the integrated programs, as well as the increasing participation of least developed countries (LDCs) and small island developing states (SIDS) in the integrated programs, where absorptive capacity, government contribution, and domestic cofinancing are more limited.
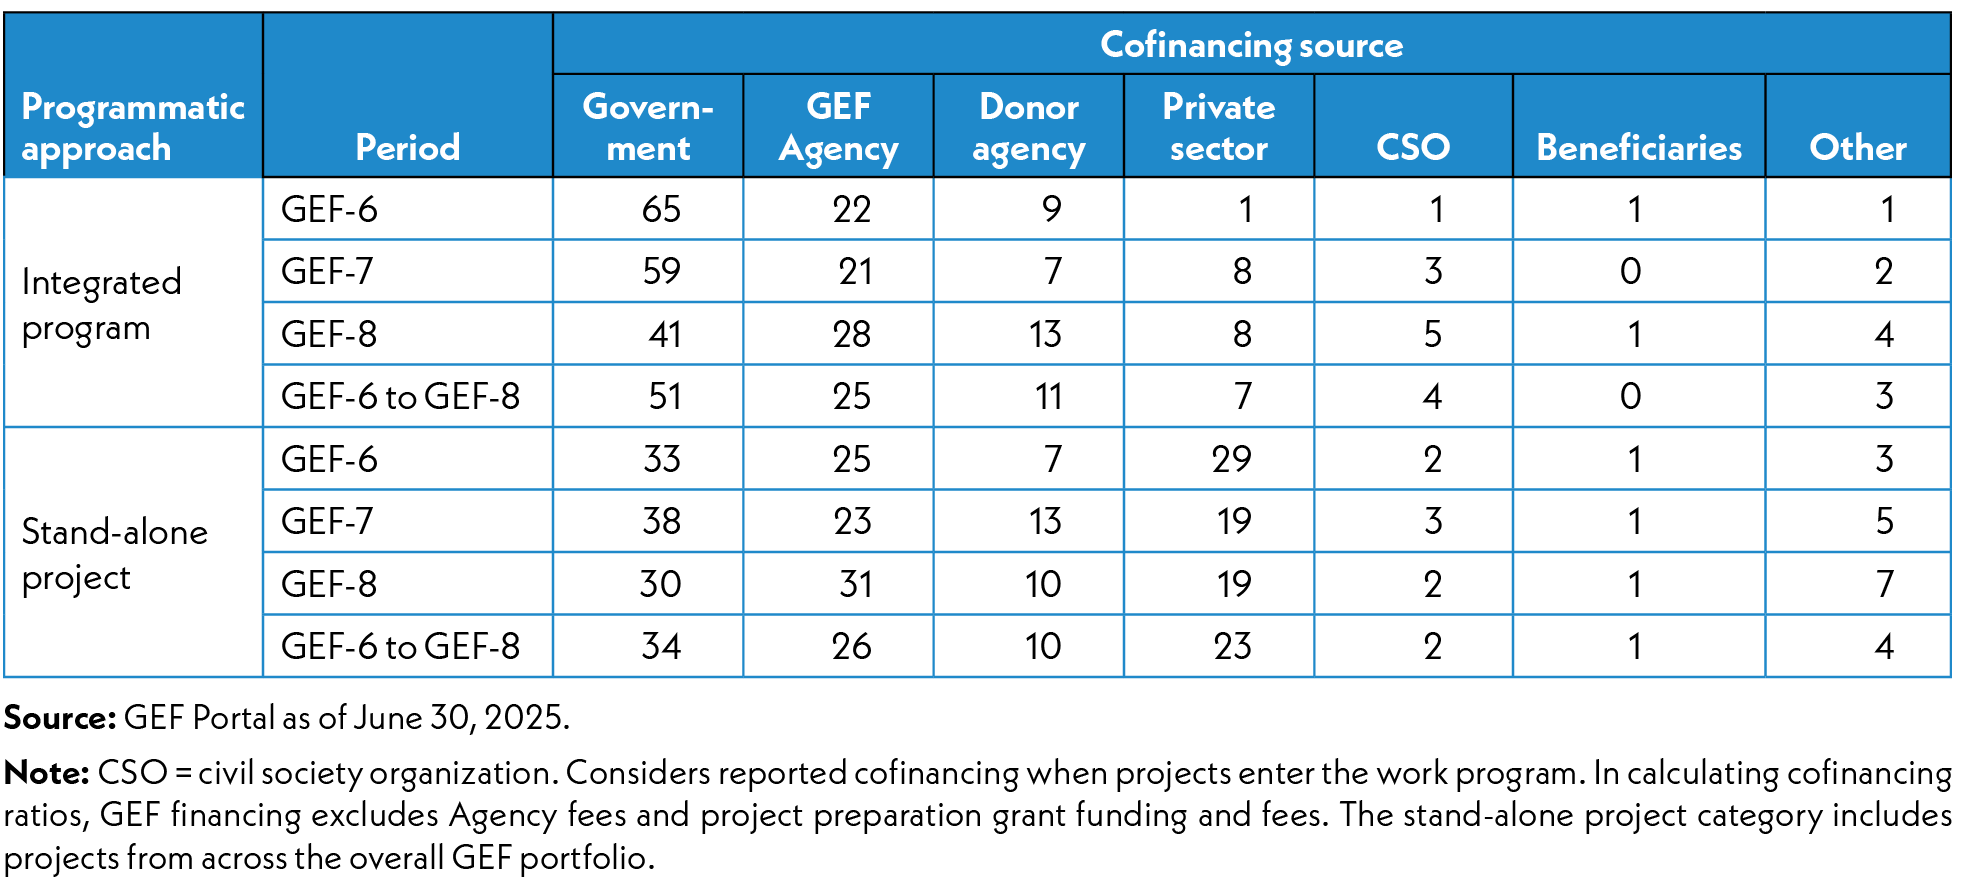
Integrated programs have relied more heavily on government financing and less on private sector contributions than have stand-alone projects. Government contributions averaged 51 percent for integrated program child projects across GEF-6 to GEF-8, although this share declined from 65 percent in GEF-6 to 41 percent in GEF-8 (table 6.4). In contrast, stand-alone projects maintained a relatively stable average of 34 percent in government contributions over the same period. Private sector financing, while low overall for integrated programs, increased from 1 percent in GEF-6 to 8 percent in GEF-8, averaging 7 percent across replenishment periods. This remains significantly below the average for stand-alone projects, where private sector contributions averaged 23 percent—although that share has been declining since GEF-6.
GEF-8 integrated programs saw a marked increase in country participation, with a particular emphasis on engaging LDCs and SIDS. The number of participating countries rose from 22 in GEF-6 to 98 in GEF-8. This includes a rise in LDCs from 8 to 31 and the introduction of 26 SIDS, largely due to the launch of the Blue and Green Islands Program. Among the GEF-8 programs, Food Systems had the broadest participation with 32 countries; followed by Amazon, Congo, and Critical Forest Biomes (28), and both Sustainable Cities and Ecosystem Restoration (20 each). On average, the number of countries per program doubled—from 8 under GEF-6 to approximately 17 under GEF-8—highlighting the increasing need for effective intercountry coordination and mechanisms for sharing knowledge and experience.