Evidence on outcomes is still emerging, as relatively few child projects have reached completion. To date, outcome ratings for GEF-6 IAP child projects are comparable to those of stand-alone projects. Only 22 GEF-6 IAP child projects have completed terminal evaluations, with 93 percent of these achieving outcomes in the satisfactory range, compared to 86 percent of stand-alone projects—a difference that is not statistically significant. These findings may evolve as more GEF-6 and GEF-7 integrated program child projects reach completion.
A large language model analysis of terminal evaluations for the 22 integrated program child projects and 43 stand-alone projects comparable in terms of region and focal area found that certain environmental results were reported more frequently for integrated program child projects across five categories (figure 6.2). These categories and illustrative child projects are as follows:
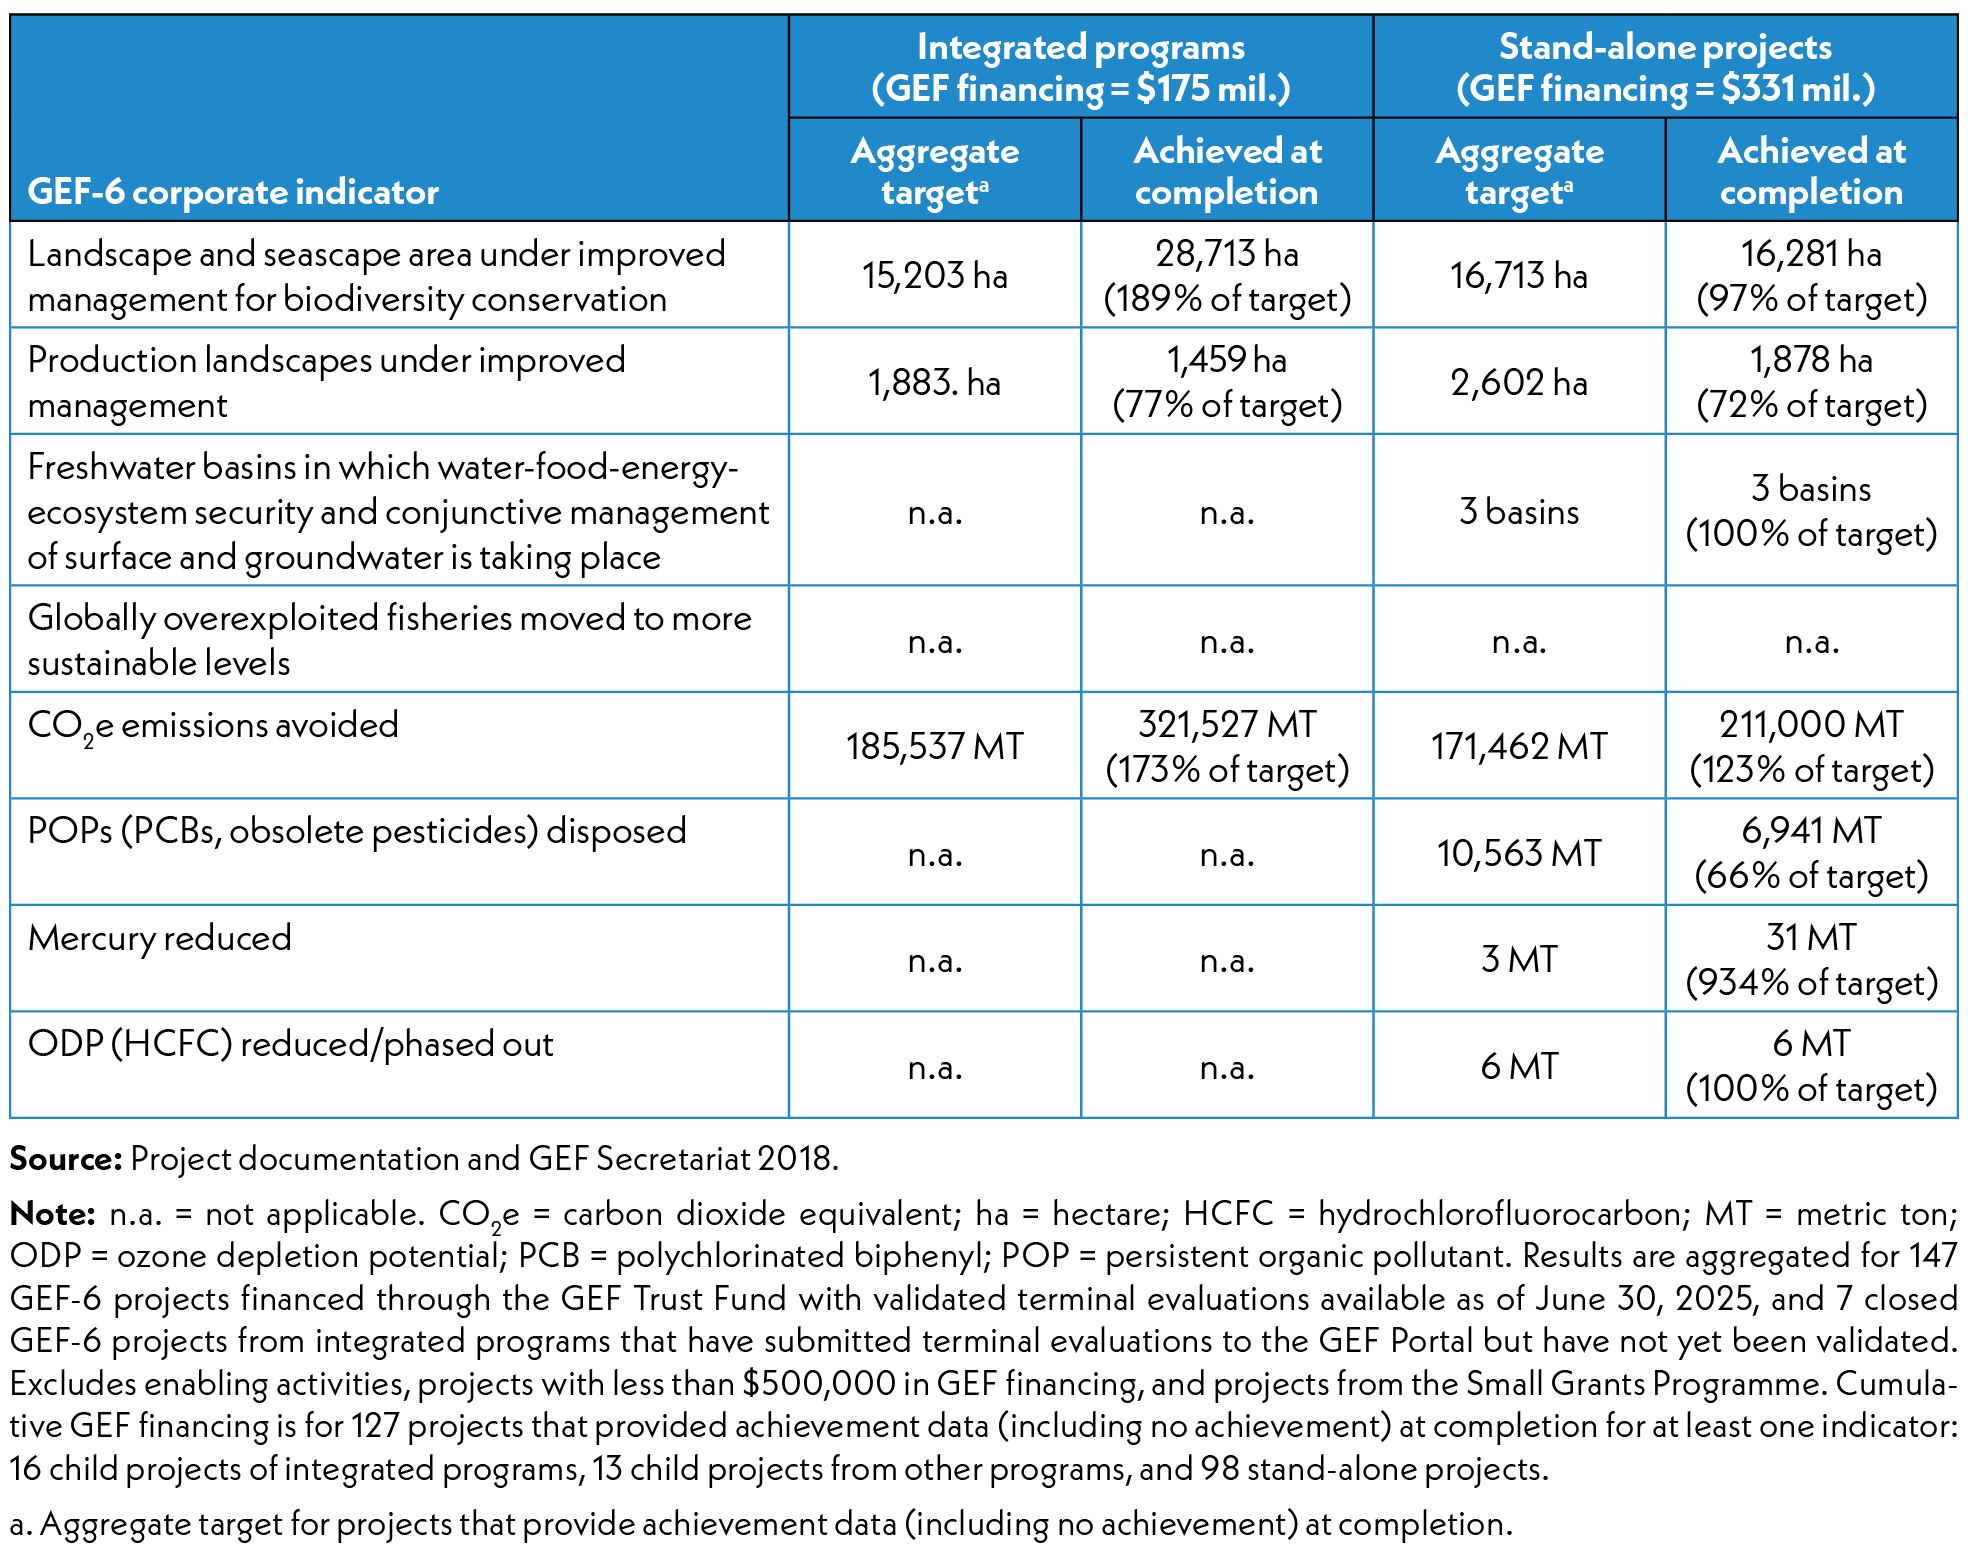
IAP child projects have demonstrated stronger performance than stand-alone projects for some GEF-6 corporate core indicators (table 6.6). A review of GEF-6 corporate core indicators suggests that the environmental and socioeconomic benefits from IAP child projects are broadly comparable to those from stand-alone projects, with some areas of stronger performance by IAP child projects. Integrated program child projects demonstrated higher achievement rates (percentage of targets achieved at completion) within a narrower set of focal areas, particularly biodiversity and climate change mitigation. For example, IAP child projects achieved 189 percent of their target for improved management of landscapes and seascapes for biodiversity conservation, compared to 97 percent for stand-alone projects. Similarly, in greenhouse gas mitigation, IAP child projects reached 173 percent of their target, versus 123 percent for stand-alone projects.
Stand-alone projects addressed a broader range of focal areas, including water resources and chemicals management—areas not targeted by IAP child projects under GEF-6. For instance, stand-alone projects achieved their target for integrated management in three freshwater basins and disposed of 6,941 metric tons of persistent organic pollutants, achieving 66 percent of a 10,563 metric ton target.
Findings on socioeconomic benefits under integrated programming are broadly consistent with those from the overall GEF portfolio. Integrated program projects show frequent and diverse benefits but also persistent challenges in inclusion, sustainability, and scaling of impact. RFS and GWP projects, for example, demonstrated tangible community-level benefits by promoting climate-smart agriculture, sustainable supply chains, and wildlife-based enterprises. For example, in Nigeria (GEF ID 9143, UNDP) and Ethiopia (GEF ID 9135), farmers adopted improved practices that bolstered yields and food security. Brazil’s Taking Deforestation Out of the Soy Supply Chain (GEF ID 9617, UNDP) leveraged green finance for zero-deforestation compliance. Wildlife projects, notably in Mozambique, engaged communities through corridor mapping and nature-based livelihoods, enhancing local ownership and income diversification.
Limitations to the achievement of socioeconomic benefits are apparent, however. Many programs struggled to systematically include marginalized groups, and the use of financial incentives for sustainable practices remained more aspirational than realized. The ambition of integrated approaches often outpaced available local capacity, curtailing implementation. Inclusion strategies, while present in some portfolios, lacked consistent application, and behavior change initiatives—such as community boards or demand reduction campaigns—showed limited uptake or measurable impact. Issues related to inclusion are further discussed in section 6.7.

Integrated programming has sought to shift institutional dynamics and align national policies with global environmental objectives. While substantial progress has been made, institutional transformation is constrained by political, technical, and financial shortfalls and a lack of documentation. However, across the Food Systems programs, notable strides were made in establishing institutional coordination mechanisms. Nearly three-quarters of child projects created or reinforced multisector platforms, bringing together ministries of agriculture, environment, and planning. Under FOLUR, 90 percent of projects incorporated explicit cross-sector coordination. In Peru’s FOLUR project—Deforestation Free Commodity Supply Chains in the Peruvian Amazon (GEF ID 10307, UNDP)—policy adjustments were introduced to align land tenure instruments with the European Union Deforestation Regulation, helping formalize rights for smallholders and integrate them into sustainable supply chains.
The GWP advanced institutional frameworks in countries facing severe biodiversity threats and illegal wildlife trade. In Thailand, this helped enhance law enforcement capacity through the introduction of DNA/NMR-based forensic tools and the IBM i2 criminal intelligence system. Gabon established a regional ivory traceability laboratory using genetic technologies, providing services across Central Africa. In Mozambique, national authorities implemented a traceable timber regulation system as well as georeferencing of elephant corridors, and projects helped draft national wildlife crime strategies involving the judiciary, police, and customs.
The Sustainable Cities Integrated Program helped create urban platforms involving local governments, infrastructure authorities, and civil society. In Senegal and Malaysia, cities developed integrated urban development plans that mainstreamed biodiversity and climate resilience. The program also helped cities revise zoning regulations to account for ecosystem services and flood risks and enabled cities in Brazil and India to explore circular economy policies and public procurement reforms.
Policy coherence for environmental benefits was often diagnosed but not consistently addressed or documented. In the Food Systems programs, 71 percent of child projects identified policy misalignments—such as subsidies for land conversion or input-intensive farming—yet fewer than half implemented mechanisms to correct them. Many interventions were led by environment ministries, which often lacked the convening authority to align with agriculture and planning ministries. Some positive examples emerged, as in Ghana’s Landscape Restoration and Ecosystem Management for Sustainable Food Systems (GEF ID 10348, World Bank) and Reversing Land Degradation Trends and Increasing Food Security in Degraded Ecosystems of Semi-arid Areas of Central Tanzania (GEF ID 9132, IFAD), which demonstrated cross-ministry collaboration during project design. In contrast, in Peru (GEF ID 10307), agriculture and environment ministries were engaged late, limiting alignment with broader food systems policies. In the Sustainable Cities Program, while urban plans were updated, alignment with national development or finance ministries was often missing, constraining downstream implementation and investment.
An obstacle to policy coherence noted across programs was insufficient institutional capacity at the subnational level. Local agencies often lacked staff, funding, or legal authority to implement reforms. The turnover of key officials and staff at the municipal and provincial levels disrupted continuity of policy work.